
Why employee advocacy statistics 2026 matter for B2B
88% of consumers trust recommendations from people they know above all other forms of advertising (Nielsen, Global Trust Study 2021). That single finding explains why employee advocacy has moved from a nice-to-have to a core B2B go-to-market motion. When your employees share content, their networks receive it as a peer recommendation, not a brand broadcast. The employee advocacy statistics 2026 roundup below quantifies that advantage across trust, pipeline, content reach, and program outcomes.
The trust advantage is compounding. Edelman’s 2025 Trust Barometer found that employers are the most trusted institution globally, rating higher than government, NGOs, and media. At the same time, 68% of respondents are worried that business leaders deliberately mislead people. Employees sit at the intersection of that tension: they carry institutional credibility, but their authenticity is what makes the content convert.
We aggregated data from Edelman, Nielsen, LinkedIn, the Hinge Research Institute, McKinsey, and dozens of other sources to compile this employee advocacy statistics 2026 roundup.
Employee advocacy statistics 2026: key takeaways
- 88% of consumers trust recommendations from people they know above all other advertising (Nielsen, Global Trust Study 2021)
- Employer is the most trusted institution globally in 2025, ahead of government, NGOs, and media (Edelman, Trust Barometer 2025)
- 75% of employee advocates received no formal social media training from their employer (Hinge Research Institute, Employee Advocacy Study 2023)
- Social sellers generate 78% more opportunities than non-social sellers (LinkedIn, Social Selling Index data)
- Leads from employee-shared messages are 7x more likely to convert than leads from other sources (IBM, Social Selling Case Study)
- Employee-shared content gets 8x more engagement than the same content shared by the brand directly (MSLGroup, Social Employee Advocacy Study, most recent available data)
- Brand messages are re-shared 24x more frequently when distributed by employees vs. official brand channels (MSLGroup, Social Employee Advocacy Study, most recent available data)
- 64% of employee advocates credited advocacy with winning new business (Hinge Research Institute, Employee Advocacy Study 2023)
- Word of mouth is the primary factor behind 20 to 50% of all purchasing decisions (McKinsey, “A new way to measure word-of-mouth marketing”)
- SSI leaders have 45% more sales opportunities than peers with lower SSI scores (LinkedIn, Social Selling Index data)
- The employee advocacy software market is valued at $523.7M in 2025, projected to reach $1.18B by 2035 (Future Market Insights, Employee Advocacy Software Market 2025-2035)
- Social selling reduces average sales cycle time by 20 to 30% (LinkedIn, Social Selling Index data)
1. Trust and peer influence
Peer trust isn’t a preference that B2B buyers happen to have. It’s a structural feature of how purchasing decisions get made. Word of mouth is the primary factor behind 20 to 50% of all purchasing decisions (McKinsey, “A new way to measure word-of-mouth marketing”), which means the majority of deals are moving through channels companies can’t directly control. Employee advocacy is the closest a company gets to inserting a trusted voice into that process.
The numbers compound this point further. Peer recommendations generate engagement roughly 30 times higher than traditional online display advertising. And not every peer voice carries equal weight. The 8 to 10% of consumers McKinsey identifies as “influentials” generate 3x more word-of-mouth messages per recommendation, each with 4x more impact on purchase decisions. In a B2B context, that maps directly to technical practitioners, department heads, and thought-visible employees whose LinkedIn networks are dense with buyers.
92% of B2B buyers report trusting employee recommendations (Nielsen, attribution note: exact report name unconfirmed, see Methodology). Even accounting for that caveat, the direction of the data is unambiguous.
| Metric | Value | Source |
|---|---|---|
| Consumers who trust personal recommendations above all advertising | 88% | Nielsen, Global Trust Study 2021 |
| B2B buyers who trust employee recommendations | 92% | Nielsen (exact report unconfirmed) |
| Word of mouth’s share as primary factor in purchasing decisions | 20-50% | McKinsey, “A new way to measure word-of-mouth marketing” |
| Engagement lift: peer recommendations vs. display advertising | 30x higher | McKinsey, “A new way to measure word-of-mouth marketing” |
| Share of consumers classified as “influentials” | 8-10% | McKinsey, “A new way to measure word-of-mouth marketing” |
| Word-of-mouth messages generated per recommendation by influentials | 3x more | McKinsey, “A new way to measure word-of-mouth marketing” |
| Impact multiplier per influential recommendation on purchase decision | 4x | McKinsey, “A new way to measure word-of-mouth marketing” |
| Offline word-of-mouth conversations more likely to influence high-consideration purchases than digital interactions | Up to 40% | McKinsey, “Getting a sharper picture of social media’s influence” |
Edelman Trust Barometer 2025. Primary source for employer trust data cited throughout this section.
Oktopost’s employee advocacy platform lets marketing teams curate content boards, manage one-click sharing, and track employee-driven reach, engagement, and pipeline impact from a single dashboard.
2. Sales pipeline and conversion impact
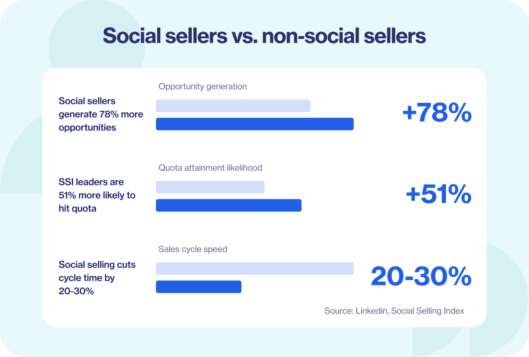
Leads generated through employee-shared messages are 7x more likely to convert than leads from other sources (IBM, Social Selling Case Study). That’s not a marginal lift. At scale, it changes where a B2B sales team should focus its prospecting energy.
LinkedIn’s Social Selling Index data puts numbers on the individual sales rep side of the equation. Social sellers generate 78% more opportunities than non-social sellers. SSI leaders have 45% more sales opportunities than peers with lower scores and are 51% more likely to hit their quotas. Social selling also cuts average sales cycle time by 20 to 30%. For B2B marketing teams running employee advocacy programs, these stats translate directly: getting sales reps active on LinkedIn and sharing company content from an advocacy board isn’t a brand exercise. It’s pipeline math.
| Metric | Value | Source |
|---|---|---|
| Conversion likelihood: employee-shared message leads vs. other sources | 7x more likely | IBM, Social Selling Case Study |
| Opportunity generation: social sellers vs. non-social sellers | 78% more | LinkedIn, Social Selling Index |
| Additional sales opportunities for SSI leaders vs. low-SSI peers | 45% more | LinkedIn, Social Selling Index |
| Quota attainment likelihood for high-SSI sales professionals | 51% more likely | LinkedIn, Social Selling Index |
| Sales cycle reduction from social selling strategies | 20-30% | LinkedIn, Social Selling Index |
| Share of purchases induced by social recommendations (across all product categories) | Average 26% | McKinsey, “Getting a sharper picture of social media’s influence” |
LinkedIn Sales Solutions, Social Selling Index. Methodology and benchmark data.
For teams looking to connect advocacy activity to pipeline, Oktopost’s social selling tools link employee sharing directly to CRM data, so you can see which deals touched advocacy content before they closed.
Shortlist position determines most B2B deals before sales ever enters. The 6sense Buyer Experience Report 2025 found that 95% of B2B purchases go to a vendor already on the buyer’s day-one shortlist. Social presence, thought leadership, and employee advocacy are the primary forces that build that shortlist position, which means advocacy ROI starts accumulating months before any sales conversation.
3. Content reach and amplification
Employee-shared content doesn’t just reach more people. It reaches a different audience entirely. Brand channels speak to followers who already know the company. Employee networks surface that content to cold audiences who’ve never seen a company post. Brand messages are re-shared 24x more frequently when distributed by employees vs. official brand channels (MSLGroup, Social Employee Advocacy Study, most recent available data).
The 8x engagement figure tells the same story from a depth-of-response angle. When content lands through an employee’s profile, the social signals that follow (likes, comments, shares) build the post’s organic distribution further. The audience isn’t just bigger. It’s warmer because it arrives through a trusted connection. Note: the MSLGroup data is flagged as “most recent available data” as the original report year was not confirmed during research. These figures have been widely cited in industry publications, but treat them as directional rather than precision-benchmarked until a dated source can be confirmed.
| Metric | Value | Source |
|---|---|---|
| Engagement lift: employee-shared content vs. brand-shared content | 8x higher | MSLGroup, Social Employee Advocacy Study (most recent available data) |
| Re-share rate: employee distribution vs. brand channel | 24x more frequent | MSLGroup, Social Employee Advocacy Study (most recent available data) |
| Average share of purchases influenced by social recommendations | 26% across all product categories | McKinsey, “Getting a sharper picture of social media’s influence” |
| Employer trust ranking globally vs. other institutions | #1 (above government, NGOs, media) | Edelman, Trust Barometer 2025 |
| Global respondents worried business leaders deliberately mislead people | 68% (up 12 points since 2021) | Edelman, Trust Barometer 2025 |
McKinsey, “Getting a sharper picture of social media’s influence”. Primary source for social recommendation and word-of-mouth purchase influence data.
The gap between personal and brand reach is measurable at scale. Analysis of 673,658 LinkedIn posts found personal profiles generate a 2.60% engagement rate versus 1.74% for company pages, a 63% higher rate for individual voices (Metricool LinkedIn Study 2026). For B2B teams with active advocacy programs, that gap is the distribution advantage they are either capturing or leaving behind.
Performance separation on LinkedIn is sharper than averages suggest. The Oktopost LinkedIn Benchmark (March 2026, 1,000+ B2B company pages) found top-decile pages hit 22.45% engagement versus a 5.72% median. Top-decile pages post significantly more employee-originated and advocacy-distributed content, which points to advocacy as a primary driver of that performance gap rather than posting frequency alone.
4. Program outcomes for advocates
The employee advocacy statistics 2026 on program outcomes are consistent: when companies invest in structured advocacy programs, participants report results across network reach, career development, and direct revenue contribution. The data below covers program-level outcomes and the gap between what advocates deliver and what employers currently provide.
Employee advocacy programs produce a dual return that’s easy to undervalue: the company gets reach and pipeline, and the individual advocate gets career visibility. 64% of advocates credited advocacy with new business wins (Hinge Research Institute, Employee Advocacy Study 2023). That’s not a soft brand metric. Nearly two-thirds of participants tied their personal sharing activity to closed deals.
The visibility gains are equally consistent. 79% of advocates reported increased company visibility, and 65% reported improved brand recognition. Those numbers come from a study of 588 professionals, 83% of whom held B2B roles, making the data directly applicable to Oktopost’s audience. When employees see their professional profile growing alongside the company’s results, participation rates stay high without requiring constant top-down pressure.
| Metric | Value | Source |
|---|---|---|
| Advocates reporting increased company visibility | 79% | Hinge Research Institute, Employee Advocacy Study 2023 |
| Advocates reporting improved brand recognition | 65% | Hinge Research Institute, Employee Advocacy Study 2023 |
| Advocates crediting advocacy with new business wins | 64% | Hinge Research Institute, Employee Advocacy Study 2023 |
| Study sample size | 588 professionals (83% B2B) | Hinge Research Institute, Employee Advocacy Study 2023 |
| Global employees who trust their employer | 75% (3-point drop vs. prior year, still highest globally) | Edelman, Trust Barometer 2025 |
Hinge Research Institute, Employee Advocacy Study 2023. Primary source for program outcome data in this section.
Oktopost’s employee advocacy analytics give marketing teams visibility into which advocates are driving the most reach, engagement, and downstream pipeline, without requiring manual tracking.
5. Training and enablement gaps
75% of employee advocates received no formal social media training from their employer (Hinge Research Institute, Employee Advocacy Study 2023). Companies are asking employees to represent the brand on social media while skipping the step that would make them effective at it. That gap is the single biggest friction point between an advocacy program that launches and one that scales.
The employer trust data from Edelman (75% of employees globally trust their employer) suggests the willingness to participate isn’t the problem. Employees, broadly, are open to aligning with the company. The drop-off happens at execution: no guidance on what to post, no framework for which content is shareable, and no training on how to write posts that get engagement. A program with content boards, gamification, and one-click sharing still stalls if advocates don’t know what good looks like.

| Metric | Value | Source |
|---|---|---|
| Advocates who received no formal social media training | 75% | Hinge Research Institute, Employee Advocacy Study 2023 |
| Global employees who trust their employer | 75% | Edelman, Trust Barometer 2025 |
| Employer ranking as most trusted institution | #1 since 2021 | Edelman, Trust Barometer 2025 |
| Global respondents worried about misleading business leaders | 68% (up 12 points since 2021) | Edelman, Trust Barometer 2025 |
Hinge Research Institute, Employee Advocacy Study 2023. Primary source for training and enablement data.
Oktopost’s employee advocacy platform includes pre-approved content boards and compliance workflows, which reduce the burden on individual advocates to make judgment calls about what’s safe to share.
6. Market size and industry growth
The employee advocacy software market was valued at $523.7M in 2025 and is projected to reach $1.18B by 2035, a compound annual growth rate of 8.5% (Future Market Insights, Employee Advocacy Software Market 2025-2035). That trajectory makes it one of the faster-growing categories in the MarTech stack, even by conservative estimates.
A note on the numbers: market size estimates for this category vary significantly depending on how the research firm defines scope. Base-year estimates for 2023-2024 range from $485M to $928M across Grand View Research and Allied Market Research, and CAGR estimates span from 8.2% to 16.4%. The divergence reflects genuine disagreement about which software categories count, whether stand-alone advocacy tools are bundled with broader employee communications software, and how international markets are weighted. The Future Market Insights figure cited above uses a narrower, software-specific definition and is the most conservatively scoped of the estimates we encountered. Treat the range as a directional signal rather than a precise forecast: the category is growing, and investment decisions made in 2025 and 2026 will likely look prescient by 2030 regardless of which CAGR figure proves accurate.
| Metric | Value | Source |
|---|---|---|
| Employee advocacy software market size (2025) | $523.7M | Future Market Insights, Employee Advocacy Software Market 2025-2035 |
| Projected market size (2035) | $1,184.1M | Future Market Insights, Employee Advocacy Software Market 2025-2035 |
| CAGR (2025-2035), conservative estimate | 8.5% | Future Market Insights, Employee Advocacy Software Market 2025-2035 |
| Base-year market size range (2023-2024) across research firms | $485M to $928M | Grand View Research / Allied Market Research (cross-reference) |
| CAGR range across research firms | 8.2% to 16.4% | Grand View Research / Allied Market Research (cross-reference) |
Future Market Insights, Employee Advocacy Software Market 2025-2035. Primary source for market valuation and growth projections cited in this section.
Employee advocacy statistics 2026 by the numbers
| Metric | Value | Source |
|---|---|---|
| Consumers who trust personal recommendations above all advertising | 88% | Nielsen, Global Trust Study 2021 |
| B2B buyers who trust employee recommendations | 92% | Nielsen (exact report name unconfirmed) |
| Word of mouth as primary factor in purchasing decisions | 20-50% | McKinsey, “A new way to measure word-of-mouth marketing” |
| Engagement: peer recommendations vs. display advertising | 30x higher | McKinsey, “A new way to measure word-of-mouth marketing” |
| Offline vs. digital word-of-mouth advantage for high-consideration products | Up to 40% more likely to influence purchase | McKinsey, “Getting a sharper picture of social media’s influence” |
| Social recommendations’ share of purchase decisions (all categories) | Average 26% | McKinsey, “Getting a sharper picture of social media’s influence” |
| Leads from employee-shared messages vs. other sources: conversion likelihood | 7x more likely | IBM, Social Selling Case Study |
| Opportunity generation: social sellers vs. non-social sellers | 78% more | LinkedIn, Social Selling Index |
| Sales opportunities: SSI leaders vs. low-SSI peers | 45% more | LinkedIn, Social Selling Index |
| Quota attainment likelihood: high-SSI professionals | 51% more likely | LinkedIn, Social Selling Index |
| Sales cycle reduction from social selling | 20-30% | LinkedIn, Social Selling Index |
| Engagement: employee-shared content vs. brand-shared content | 8x higher | MSLGroup, Social Employee Advocacy Study (most recent available data) |
| Re-share rate: employee vs. brand channel distribution | 24x more frequent | MSLGroup, Social Employee Advocacy Study (most recent available data) |
| Advocates reporting increased company visibility | 79% | Hinge Research Institute, Employee Advocacy Study 2023 |
| Advocates reporting improved brand recognition | 65% | Hinge Research Institute, Employee Advocacy Study 2023 |
| Advocates crediting advocacy with new business wins | 64% | Hinge Research Institute, Employee Advocacy Study 2023 |
| Advocates who received no formal social media training | 75% | Hinge Research Institute, Employee Advocacy Study 2023 |
| Global employees who trust their employer | 75% | Edelman, Trust Barometer 2025 |
| Global respondents worried business leaders deliberately mislead people | 68% (up 12 pts since 2021) | Edelman, Trust Barometer 2025 |
| Employee advocacy software market size (2025) | $523.7M | Future Market Insights, Employee Advocacy Software Market 2025-2035 |
| Projected market size (2035) | $1.18B | Future Market Insights, Employee Advocacy Software Market 2025-2035 |
Methodology and sources
This employee advocacy statistics 2026 roundup draws on primary and secondary research published between 2021 and 2026. Where data predates 2024, it is noted as the most recent available figure for that metric. No statistics are derived or estimated: every data point traces to a named primary source. Use the employee advocacy statistics 2026 data in this roundup freely with attribution to the original source named alongside each figure.
This roundup compiles data from primary research reports, industry studies, and platform-published data. All statistics are drawn from Tier 1 and Tier 2 sources listed below. No statistics were invented or extrapolated. Where primary documents were not directly accessed during research, inline attribution caveats are noted.
Last updated: April 2026.
We update this page quarterly. Stats from prior years are retained where no newer comparable data was available. Hinge Research Institute data is from the 2023 study, the most recent version published at the time of writing. Nielsen trust data is from 2021 and is the most recent published in this format.