Today marks 8 months since we launched Oktopost’s Social BI, a ground-breaking tool for B2B social media reporting. We envisioned and designed Social BI to help you track data that matters to your business and report in a way that’s tailored to your marketing goals.
And you loved it!
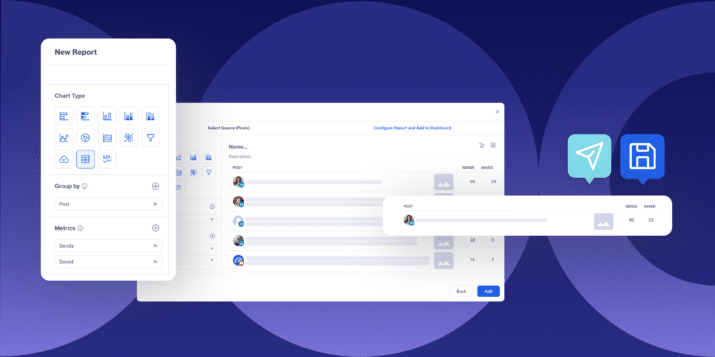
We’ve been working on adding new functionalities to make your reporting experience even more robust and flexible. In this blog post, I will go over everything we’ve added to Social BI and how these updates can elevate your social media reporting.
New data sources
As promised, we added a few new data sources, so you can monitor and analyze more things related to your social campaigns.
Link clicks
A pretty important one. With this data source, you can report on link clicks on your social posts as well as demographics and firmographic of your clicks, including things like organization, device, browser, city, etc.
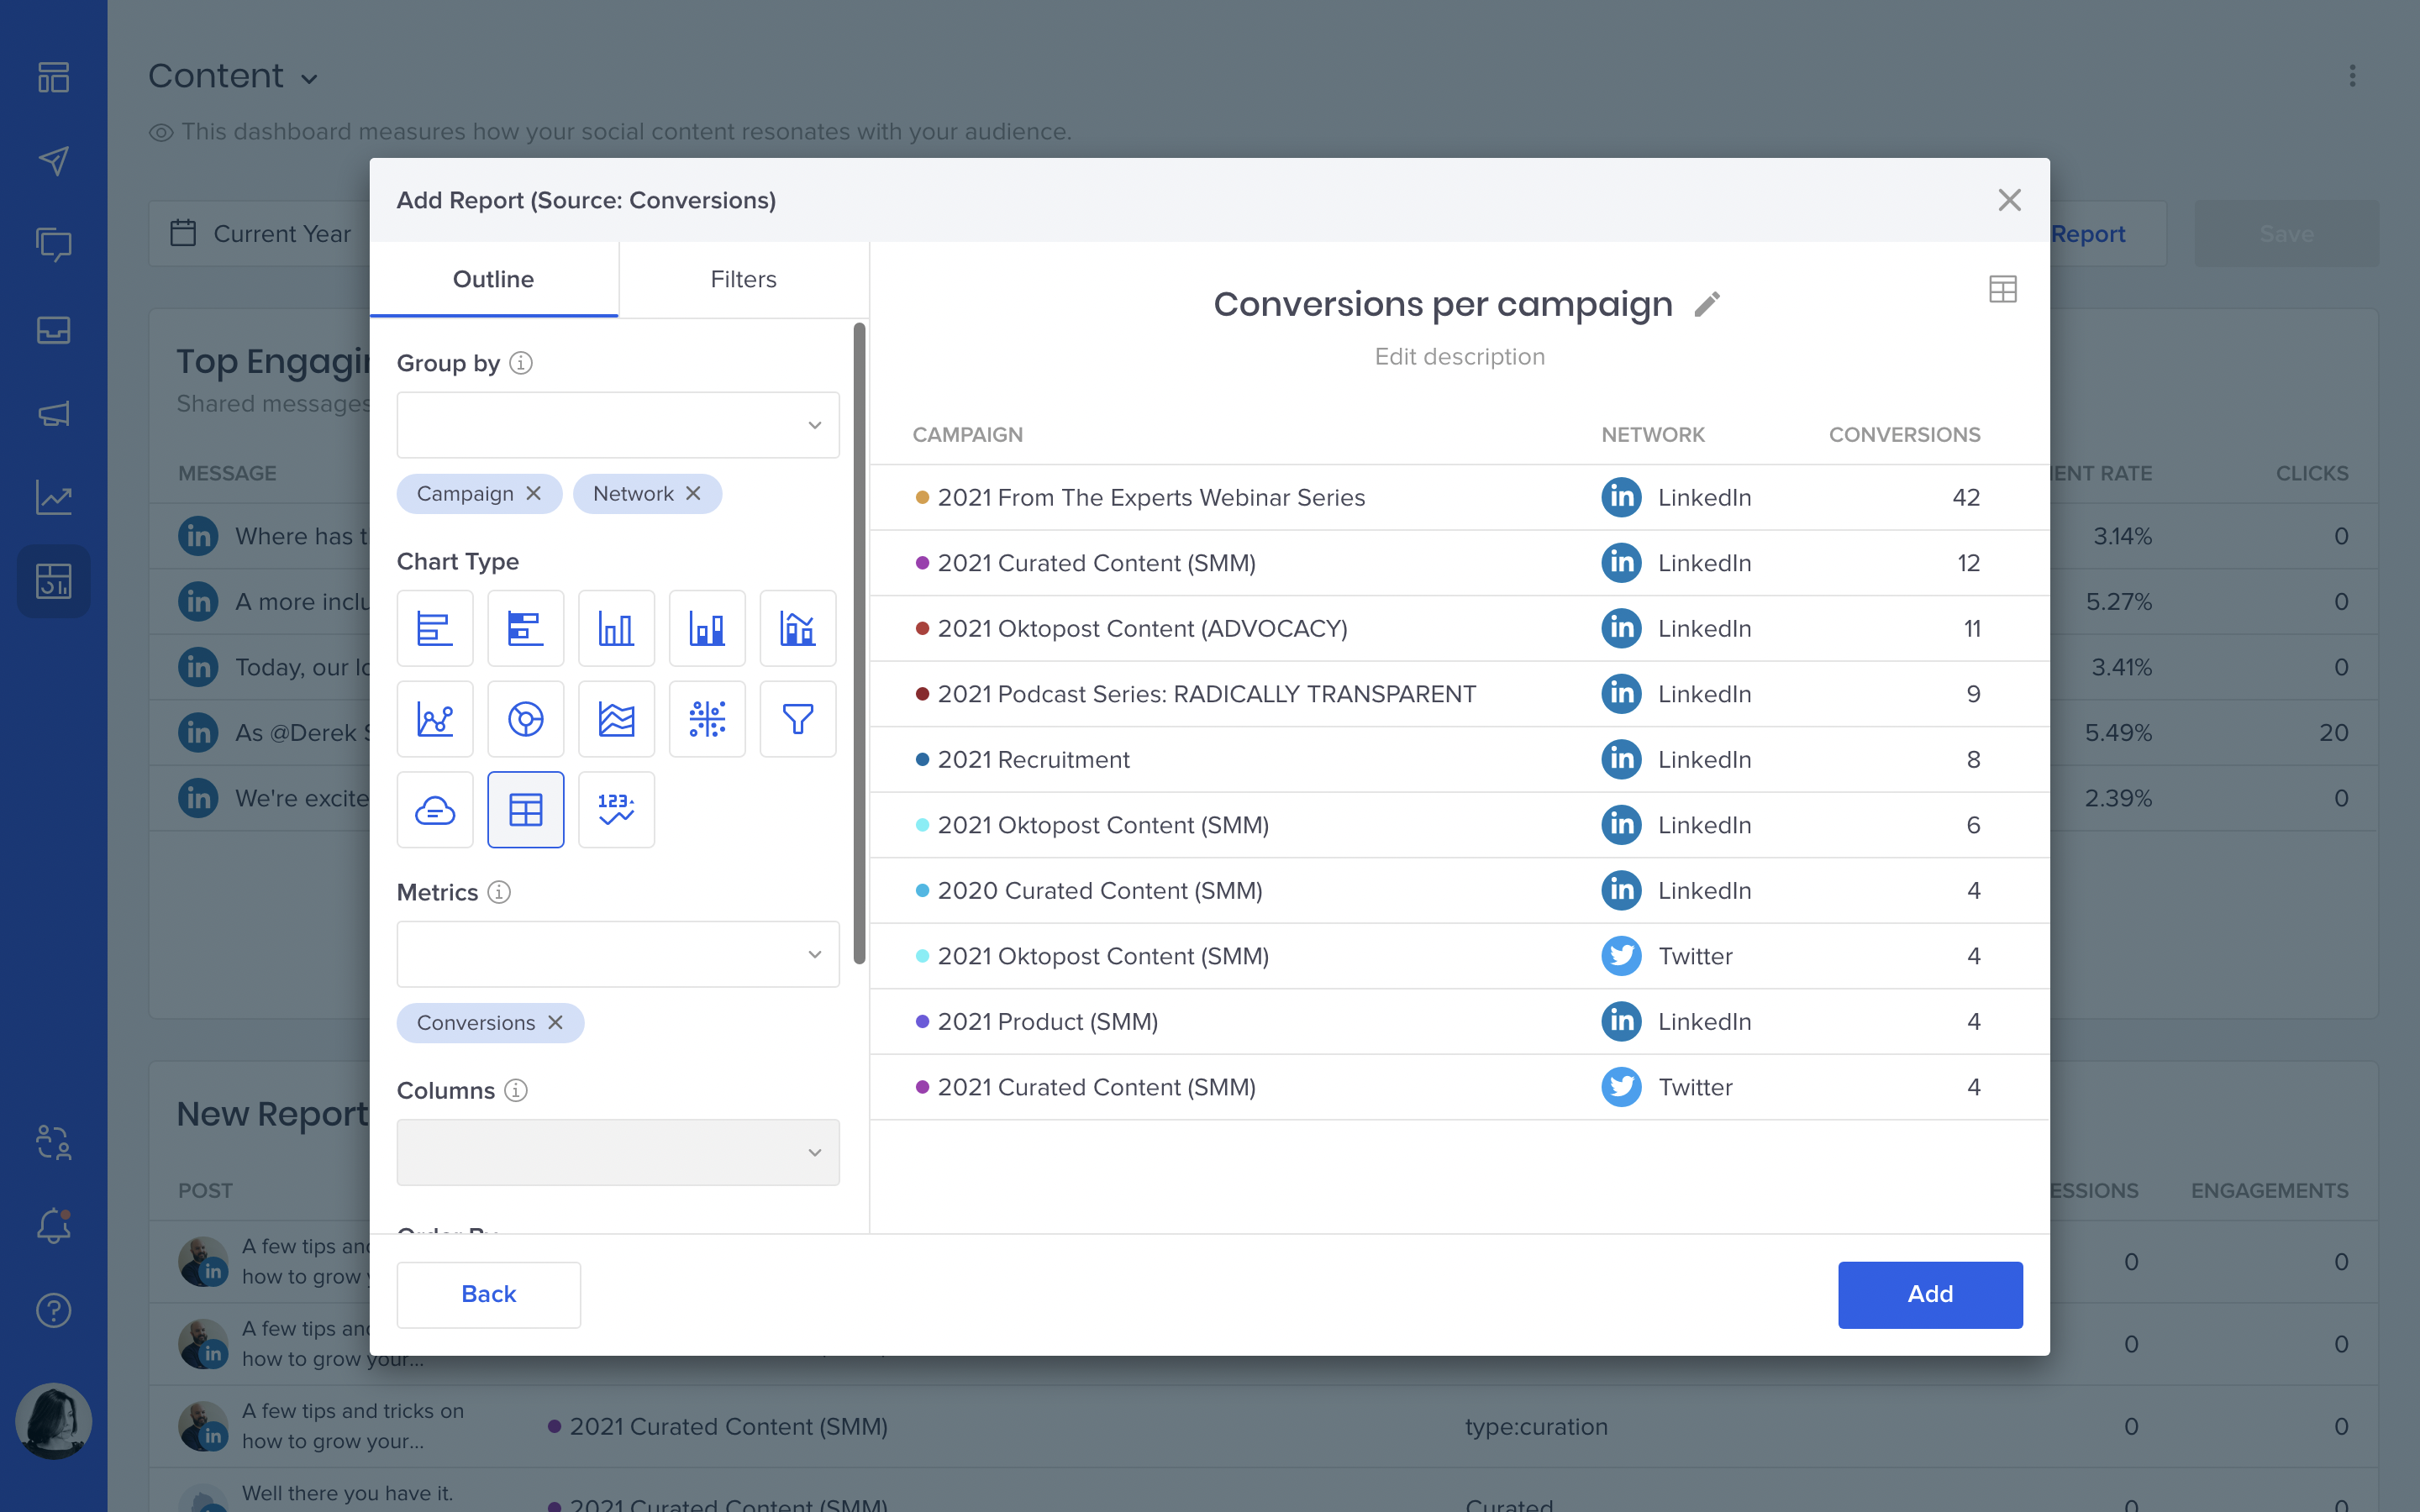
Conversions
This data source is for reporting on the number of conversions garnered by your corporate and advocacy content. It will help you understand how social media affects your revenue.
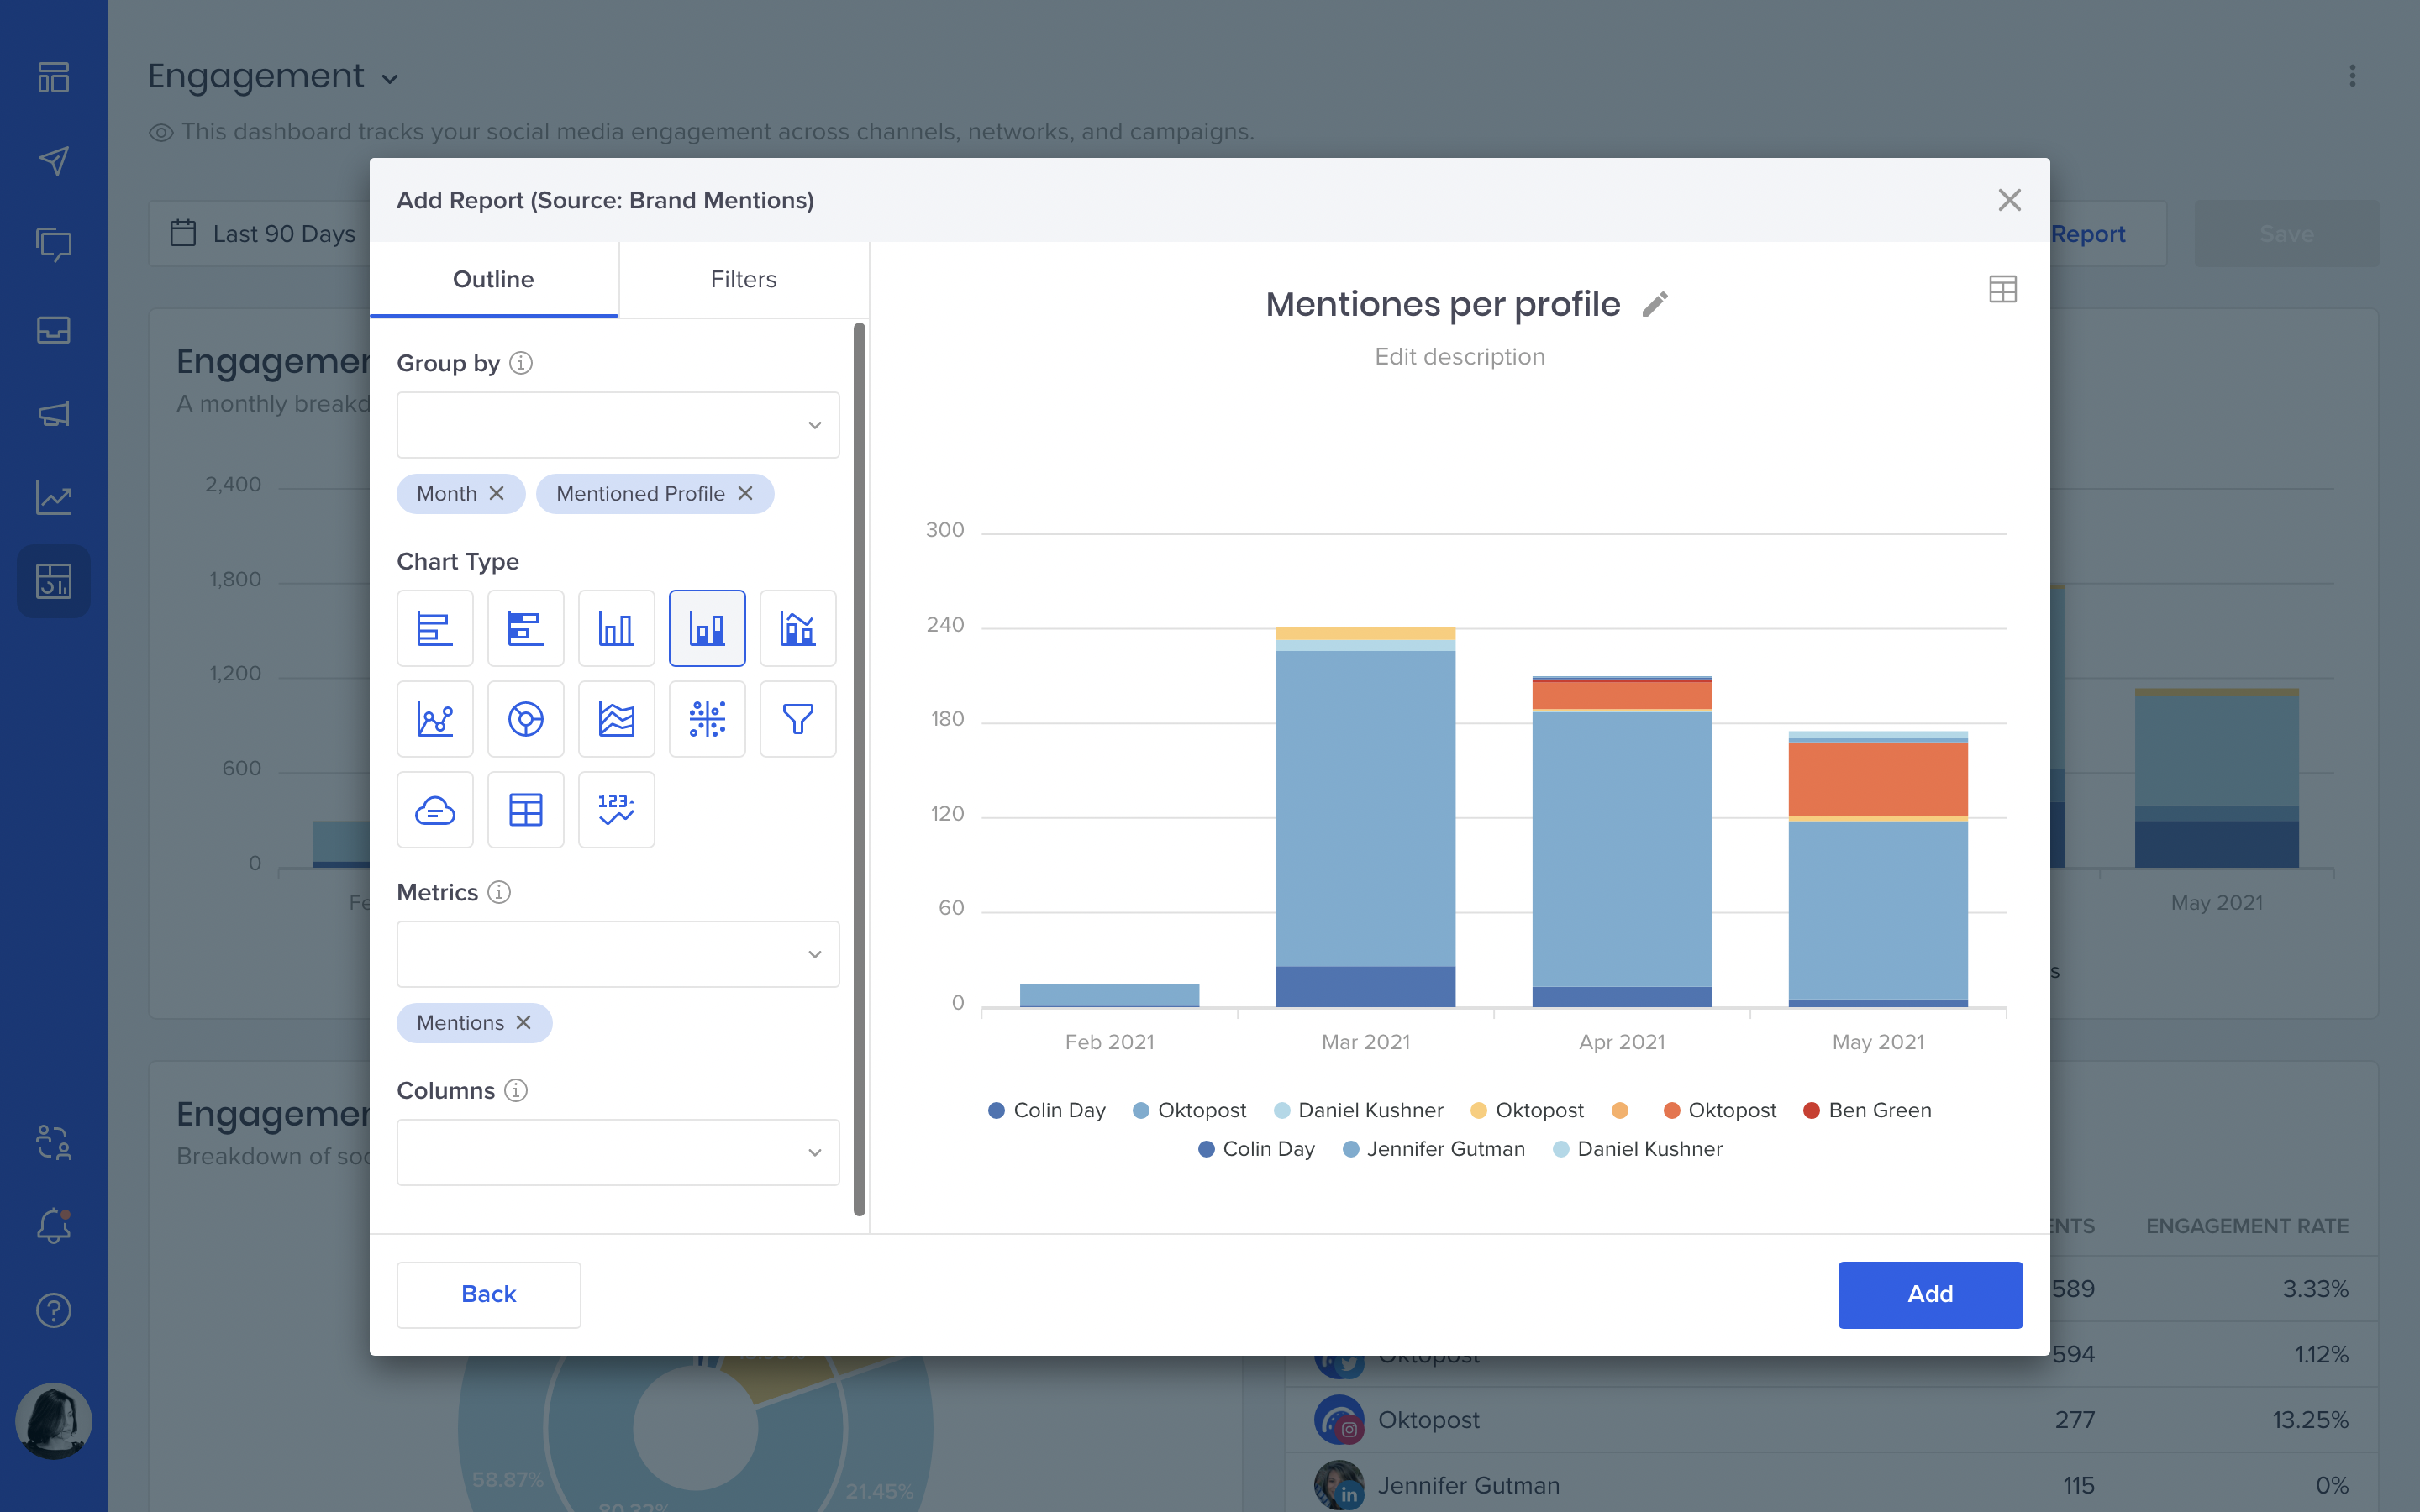
Brand mentions
Your team, customers, and yes, even competitors are talking about you on social media. I bet everyone in your organization is interested to know what they are saying.
If you want to impress your CMO with a detailed report on how your brand is being mentioned on social, what are the context and sentiment – this data source is your new best friend.
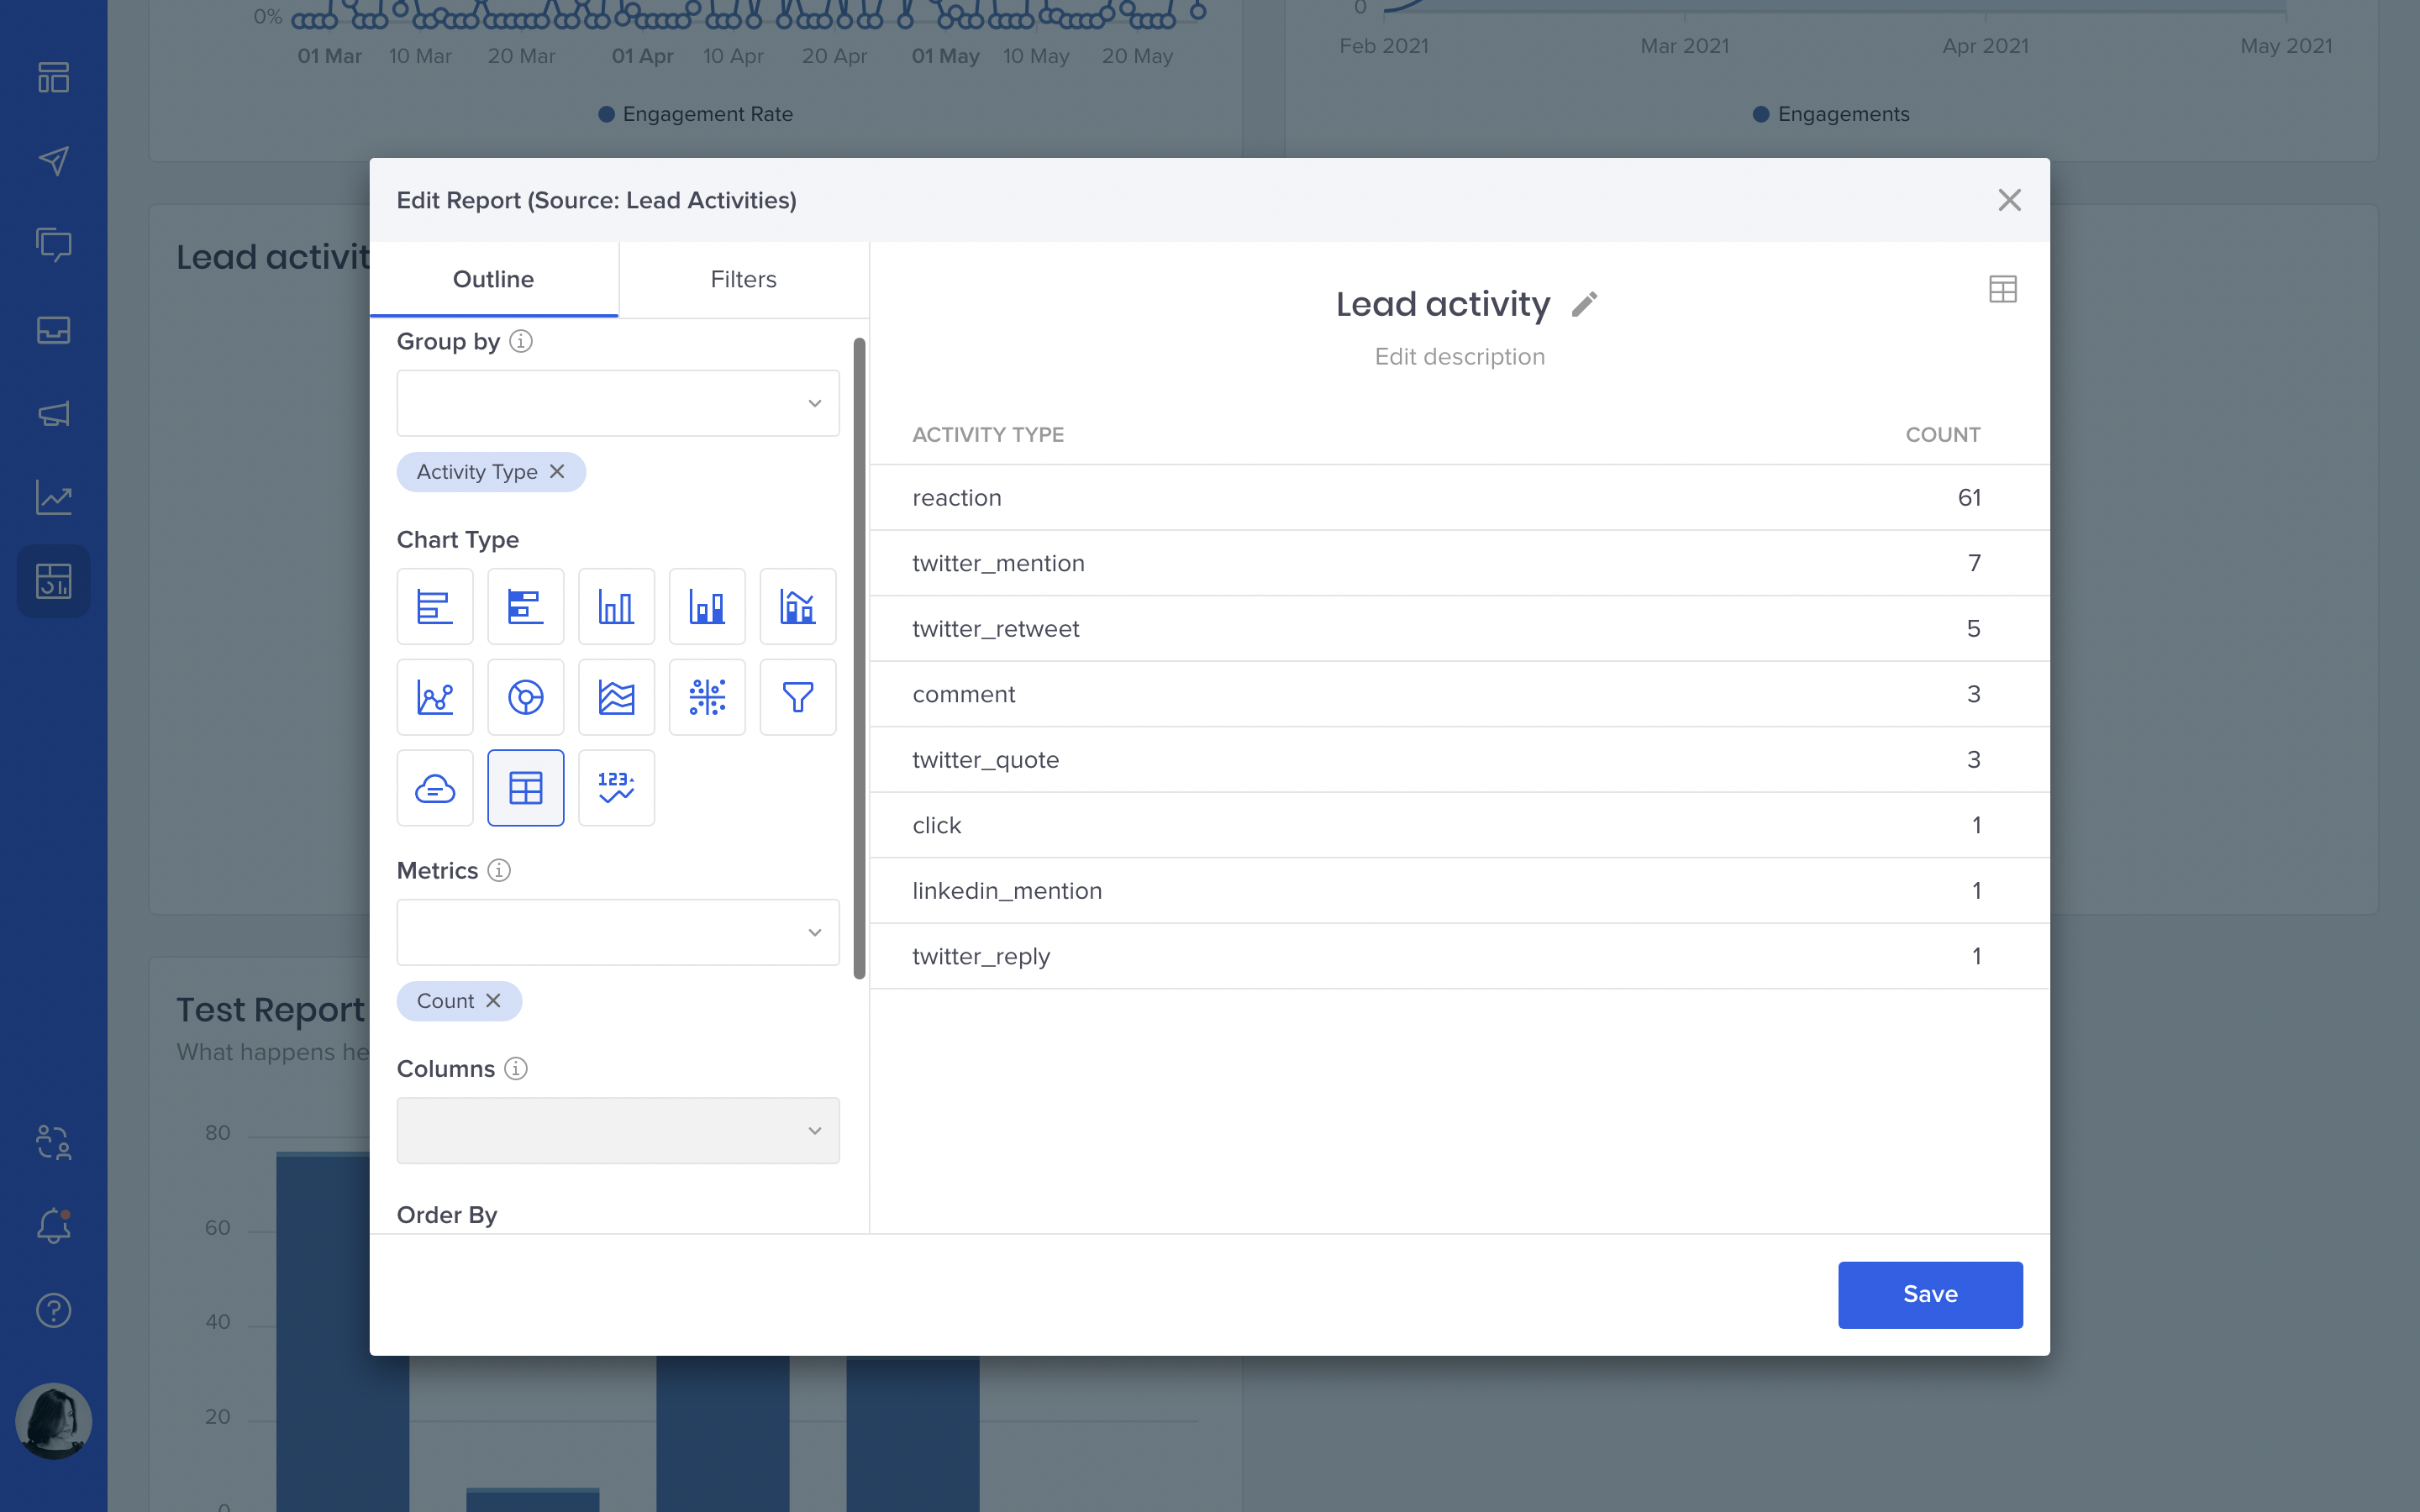
Lead activities
A data source that some of our customers have been waiting for! It allows you to report on your leads and how they engage with your social profiles. Some of the data you already have in the People Database now can be turned into a beautiful dashboard.
E.g., you can analyze how social contributes to your ABM marketing efforts by tracking not only individual leads but entire accounts (which will include everyone who works in the company and engages with your content). Lead activity reports can really drive home the importance of social media for your sales funnel.
This data source will be added to Oktopost in the next few weeks.
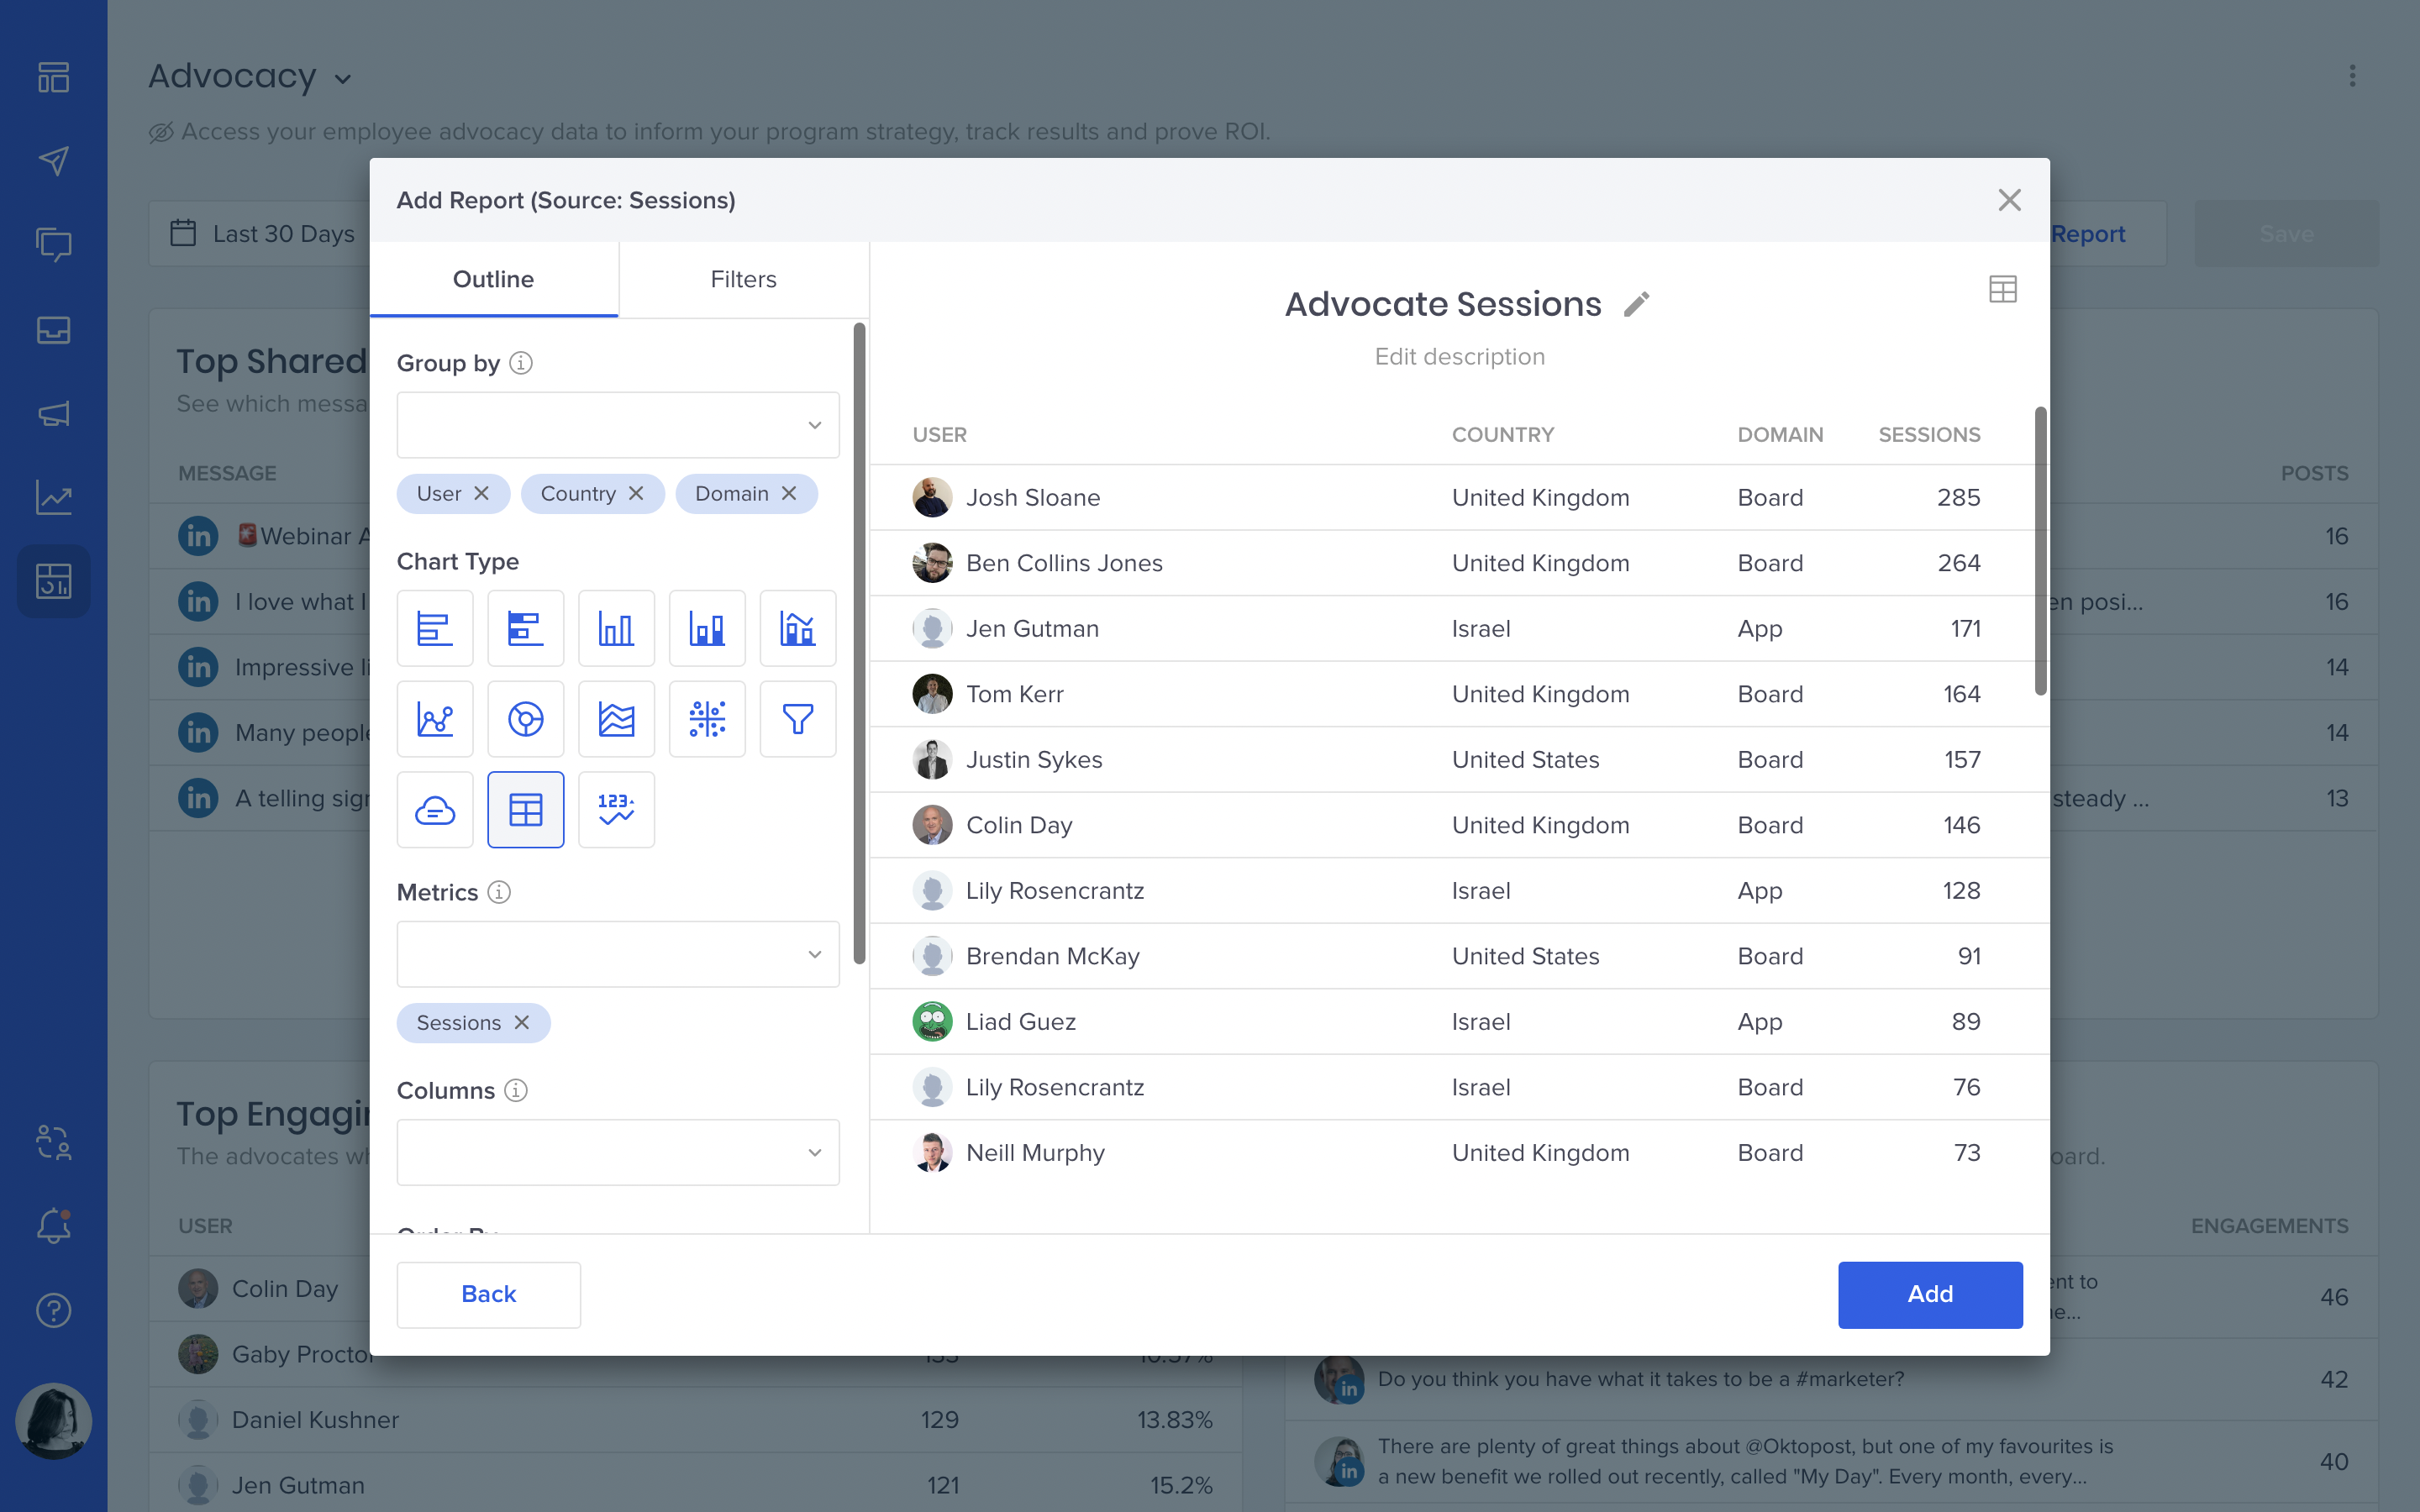
Sessions
Monitor Oktopost adoption in your organization and user logins across locations and devices. Reporting on metrics such as platform sessions can provide insights into internal employee engagement and help you scale up your social marketing initiatives.
This one can be especially helpful for monitoring advocate participation rates to understand how your program grows over time.
Additional chart types
We’re also constantly adding new chart types to help you make your reports as illustrative and meaningful as possible. The latest additions are:
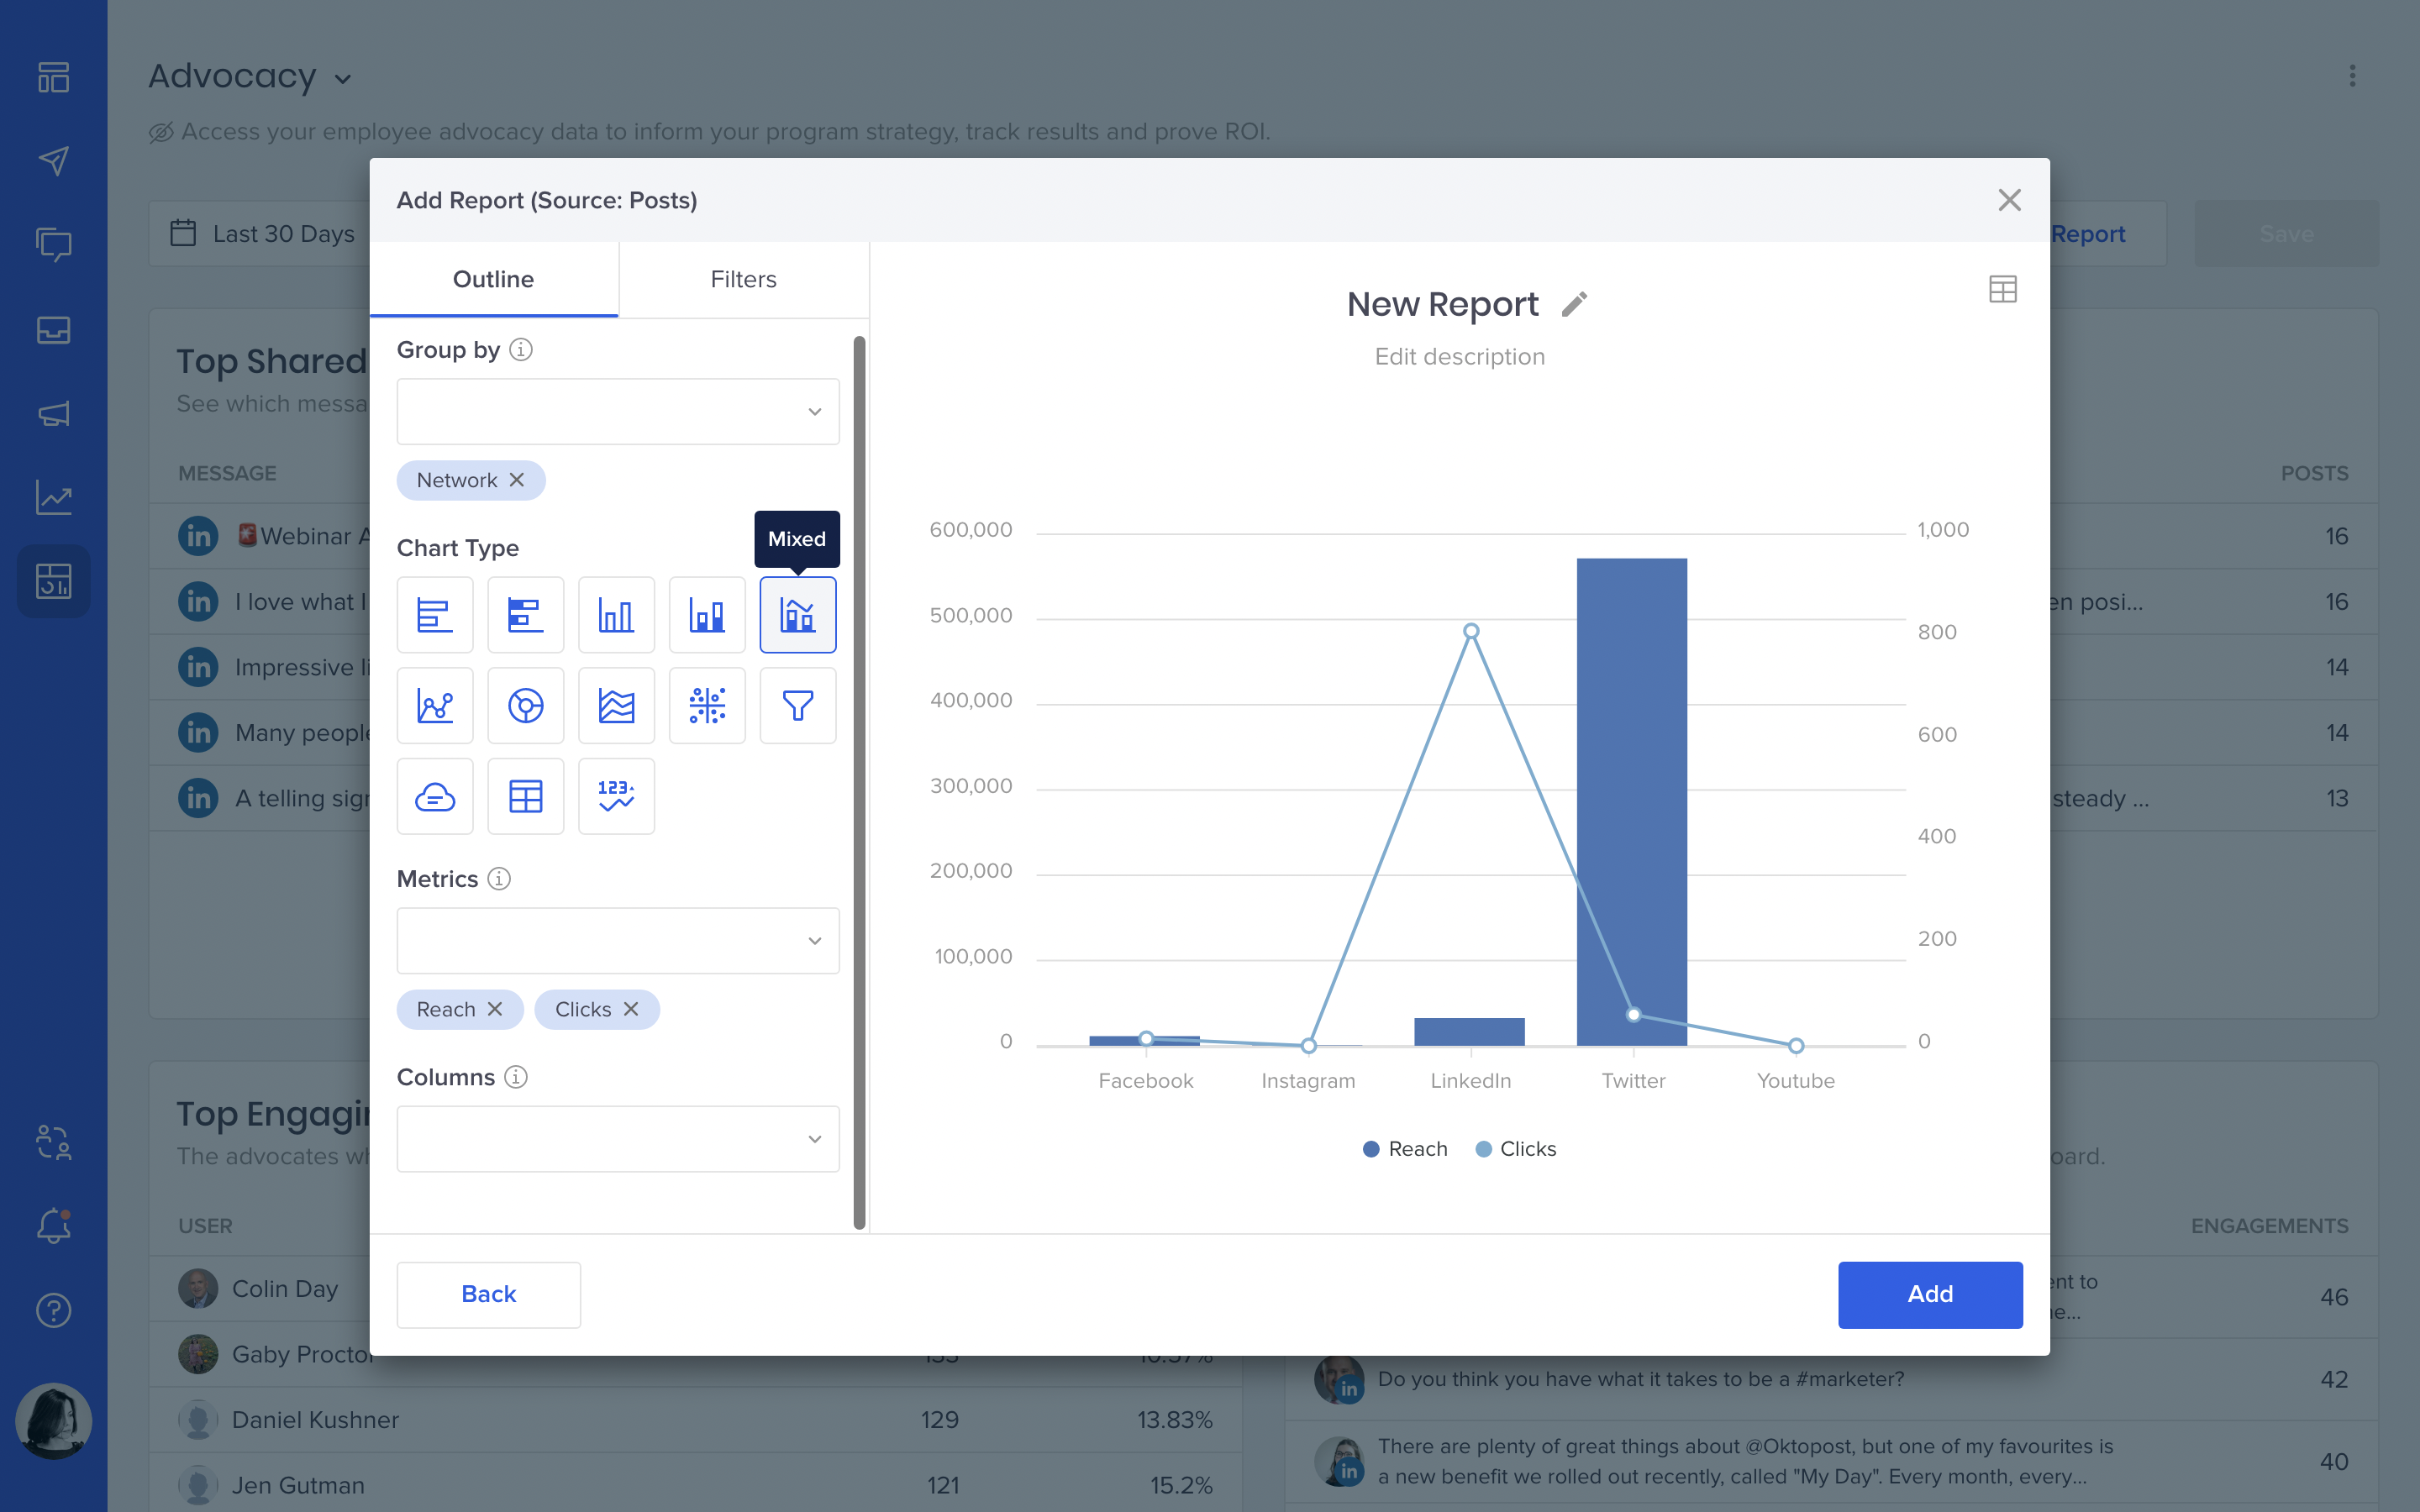
Mixed metrics
With this chart type, you can combine multiple metrics in a single visualization and see relationships between them. For example, how social likes correspond to clicks, how reach affects the number of new followers, or what’s the correlation between the number of engagement and the engagement rate.
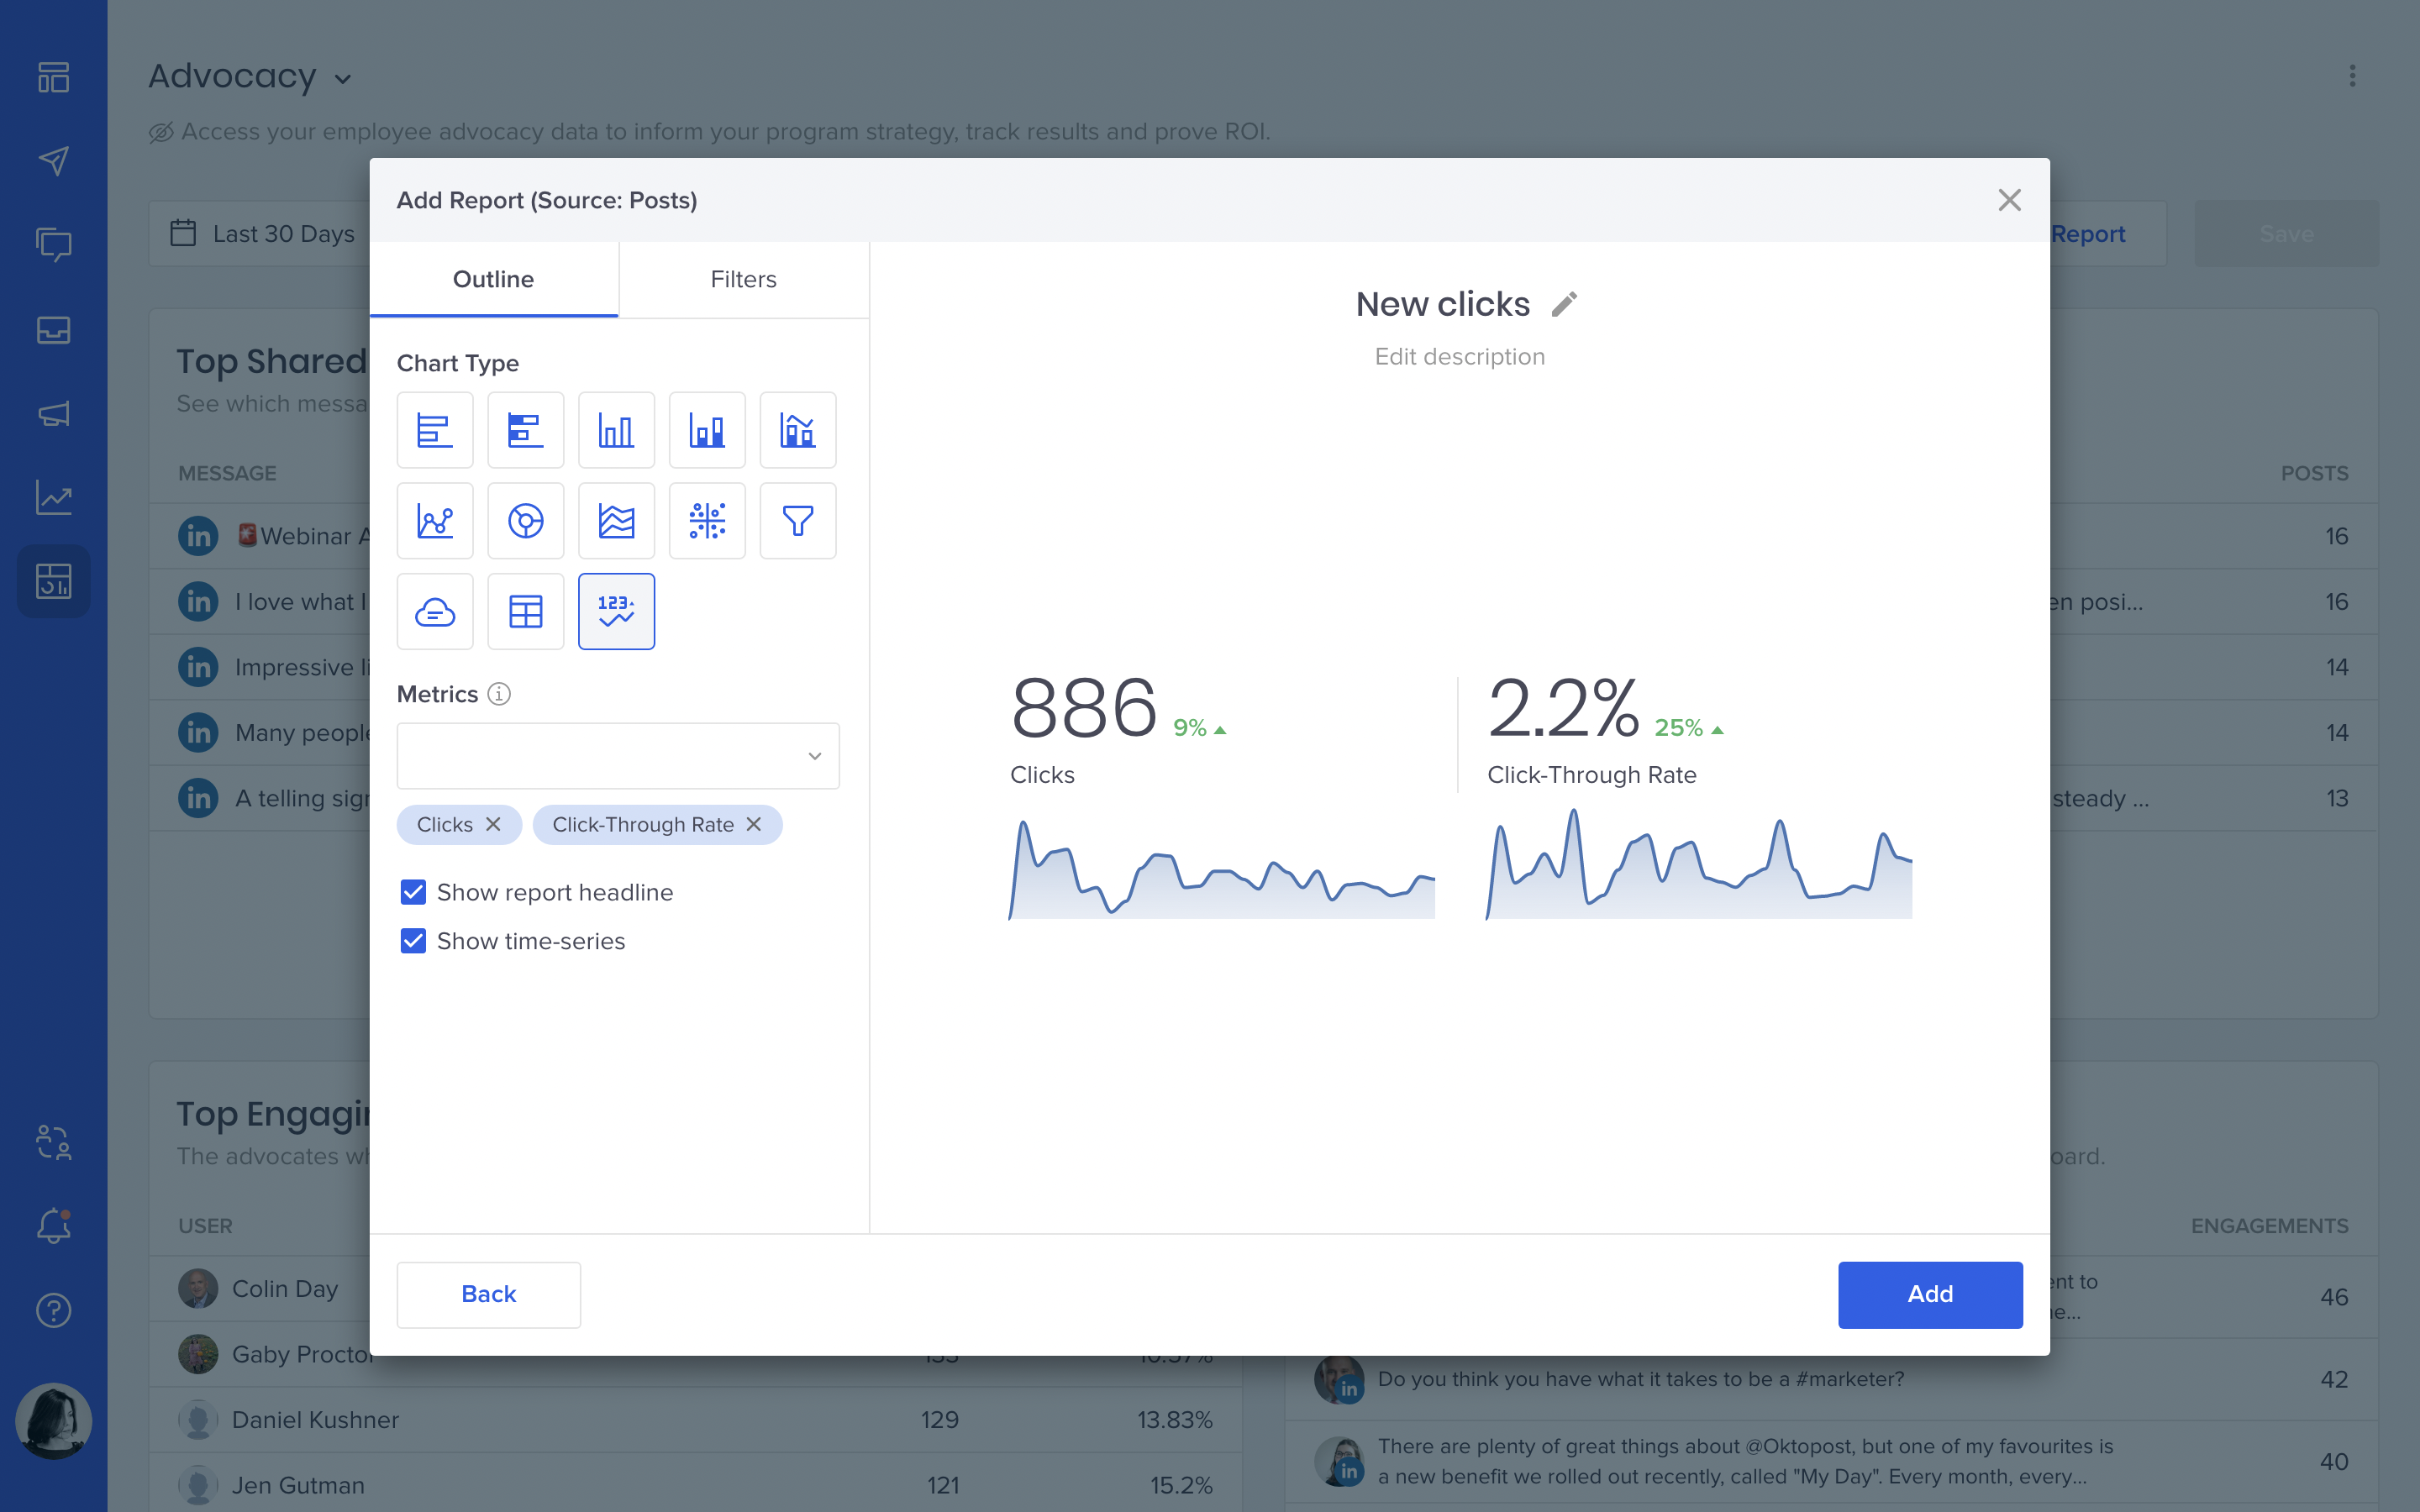
Summary KPI
A nifty little widget that will make your dashboards more visual. It shows the total number for a metric for a selected period and the change compared to the previous period.
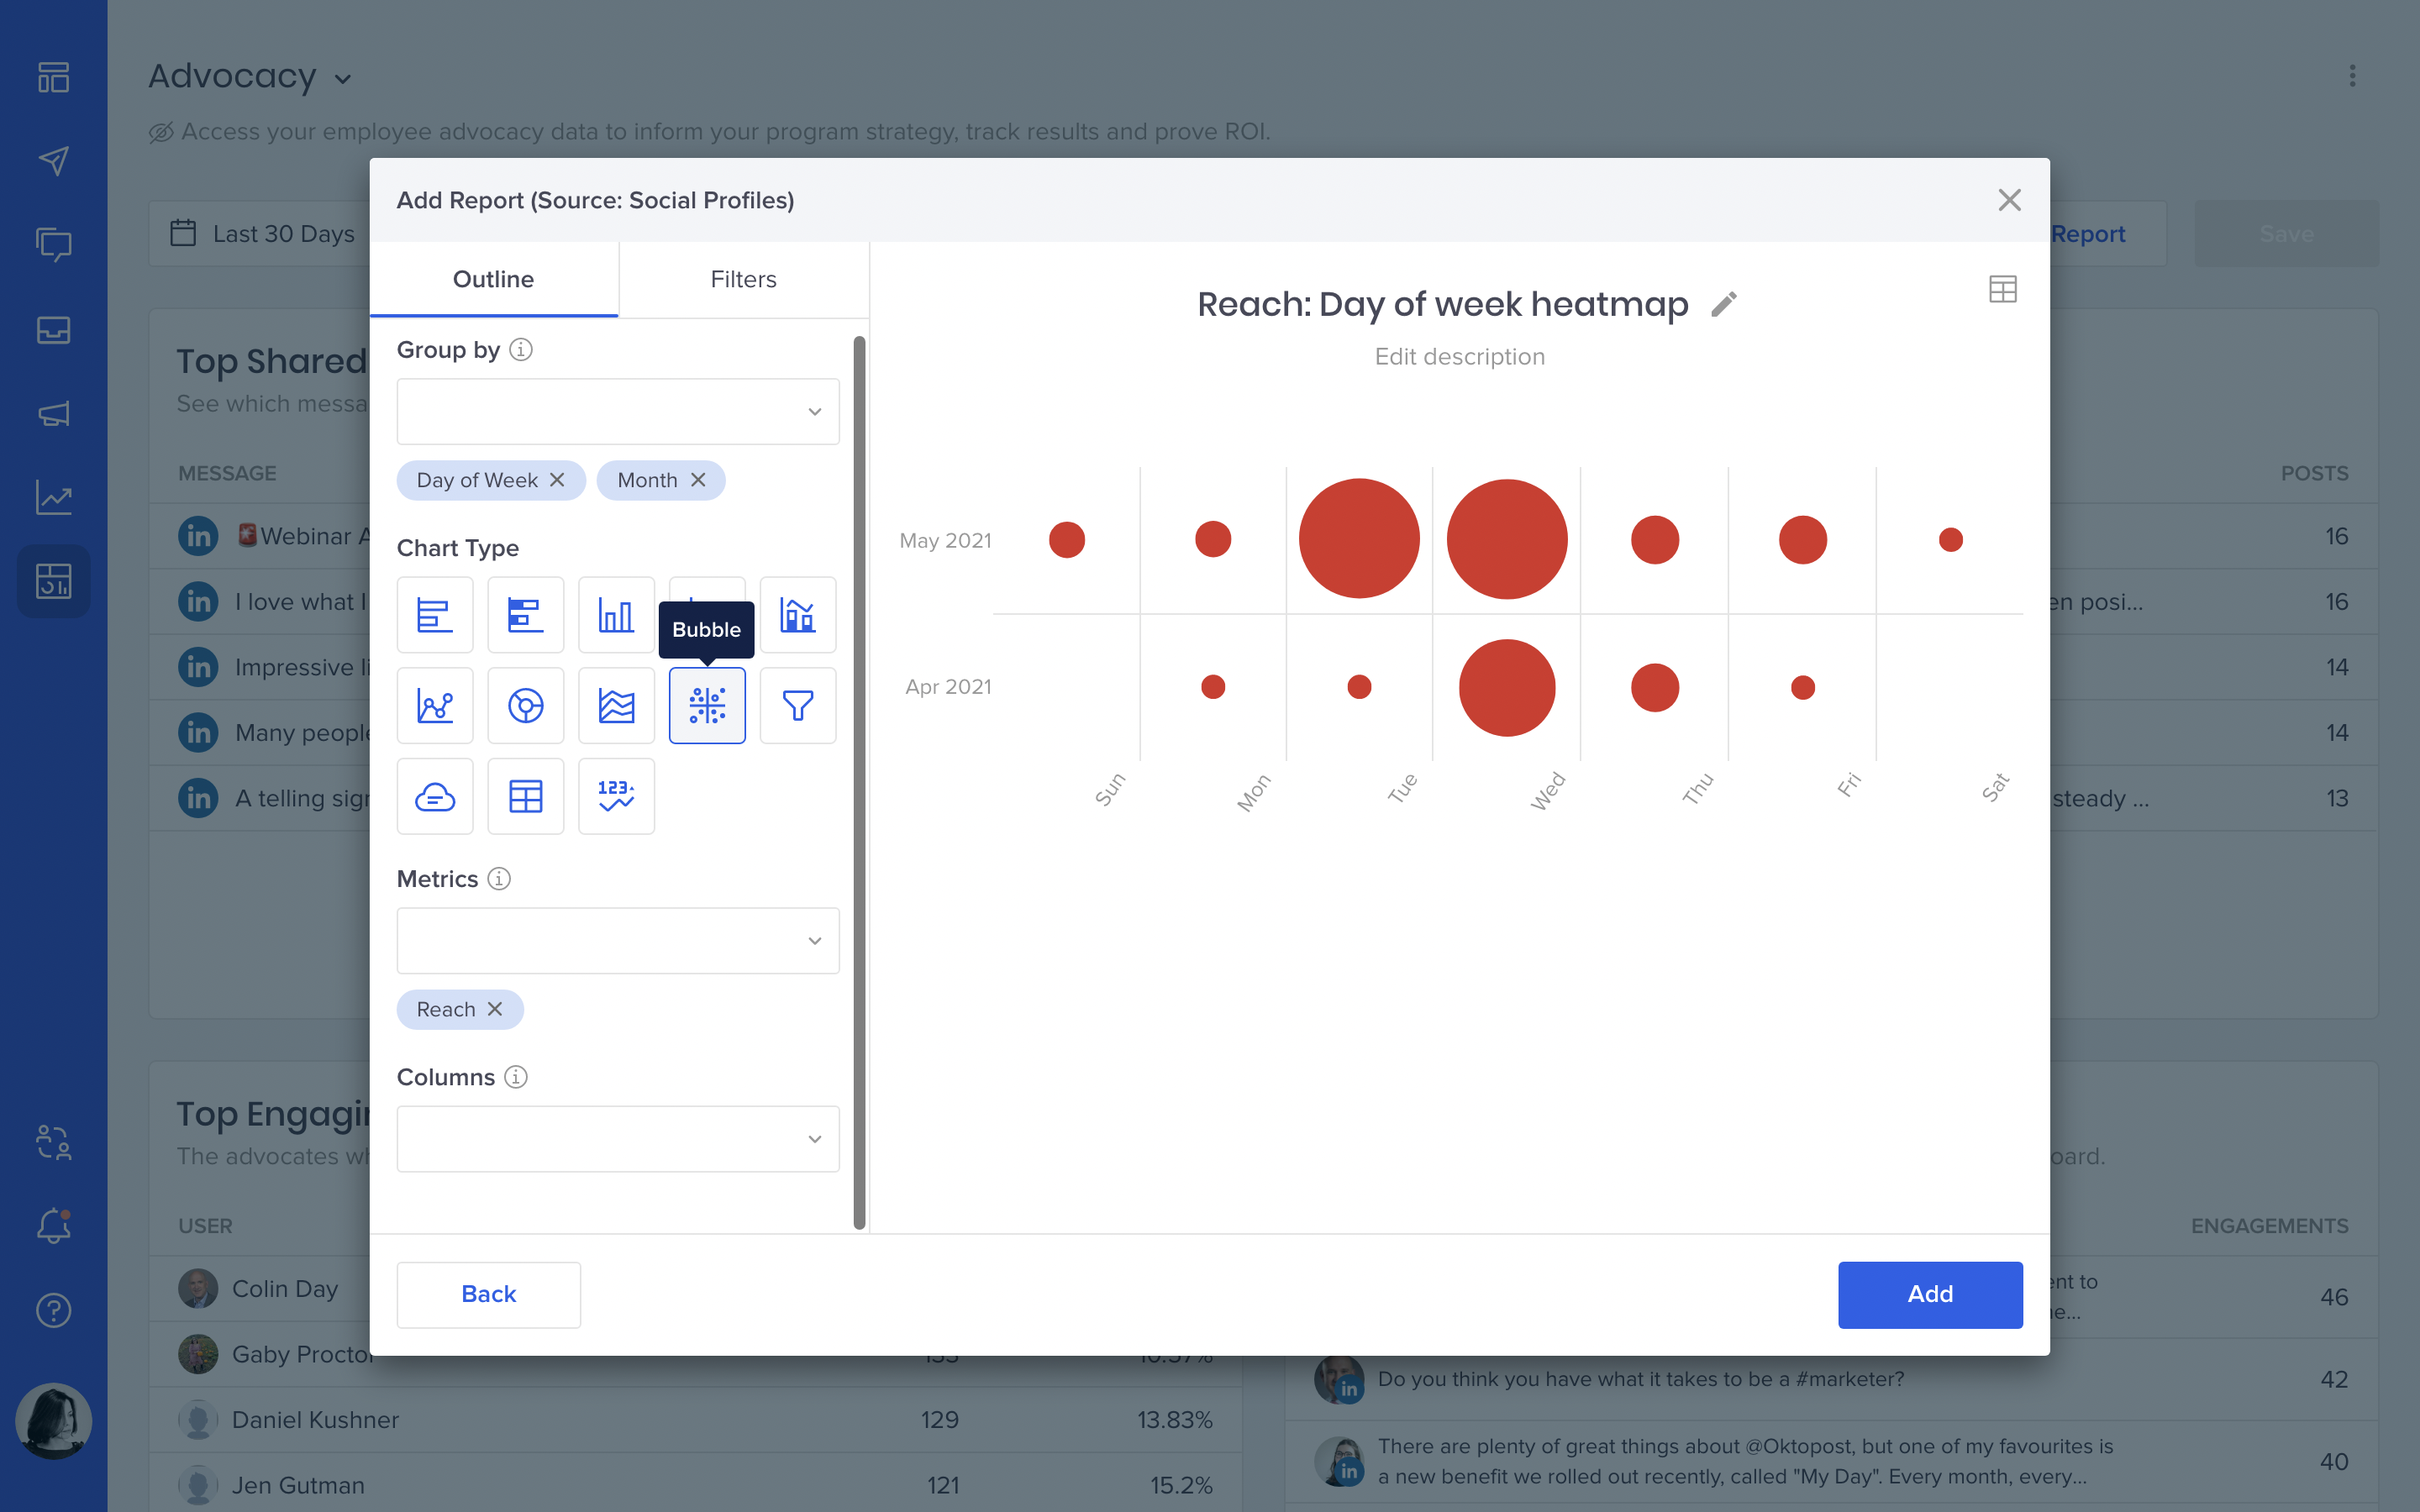
Bubbles
This one is useful for displaying three dimensions of data and emphasizing specific values using different bubble sizes and colors. Remember our ‘Engagement by Time of Day’ heatmap? Now you can customize it or make your own.
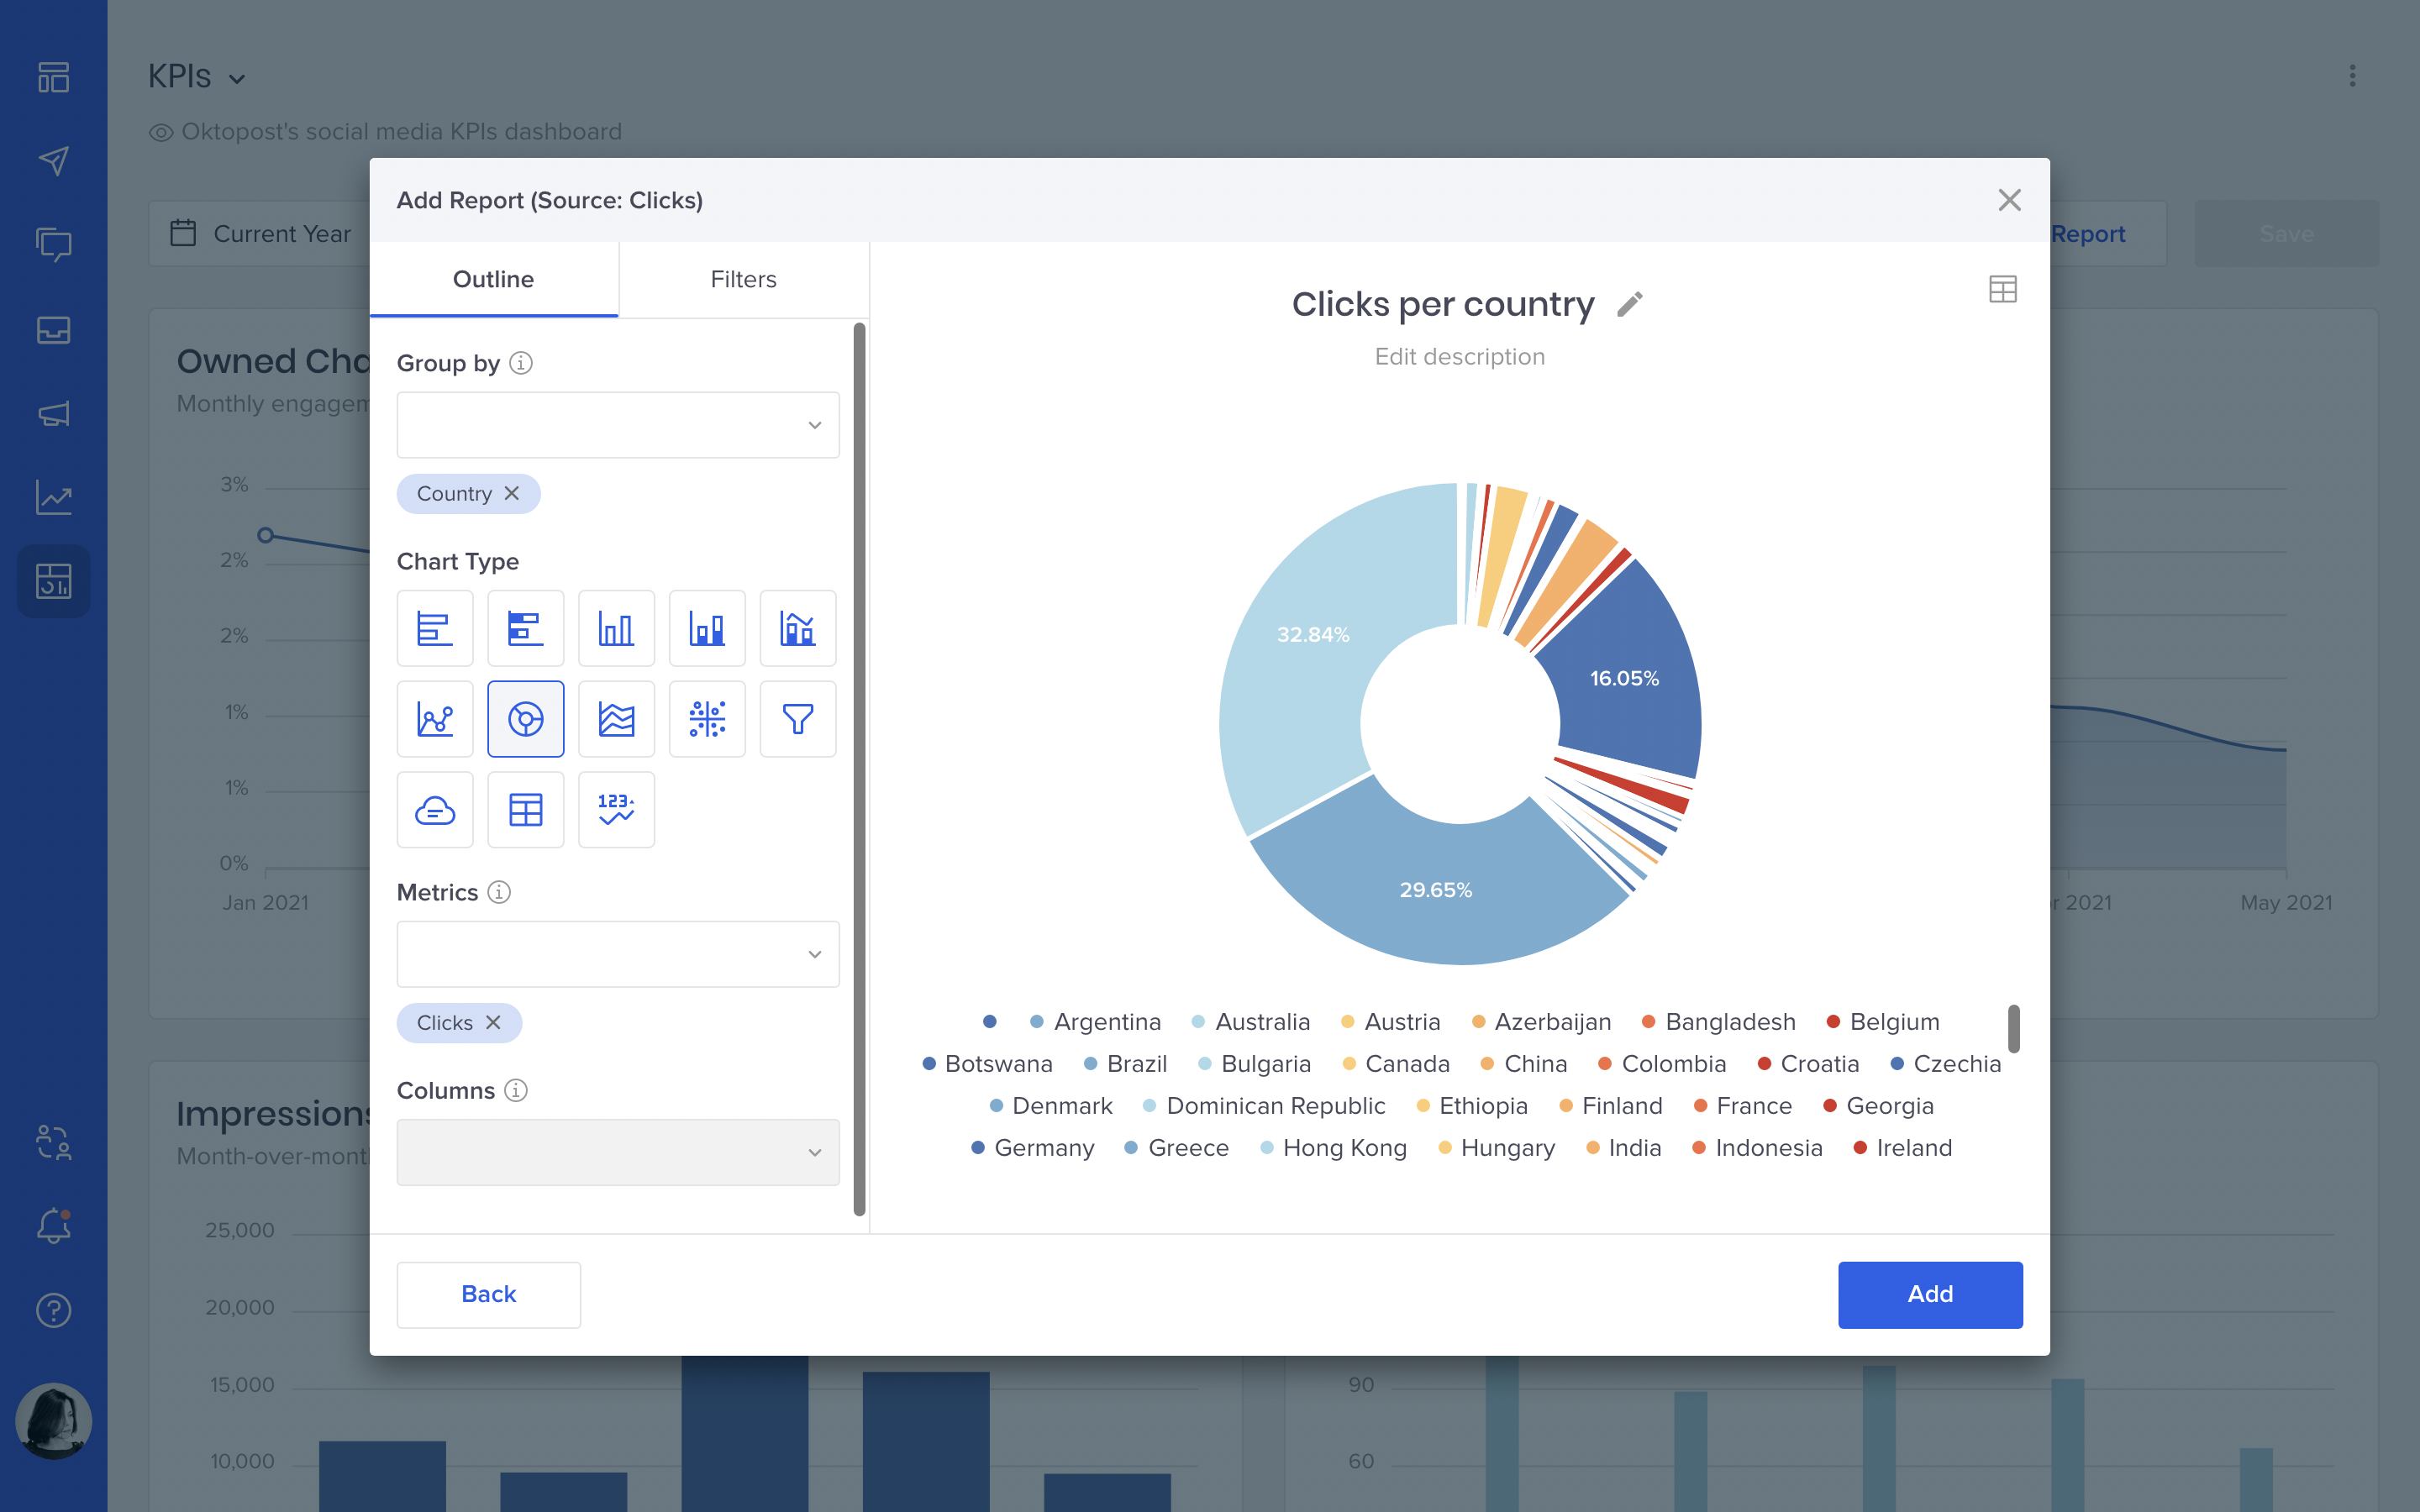
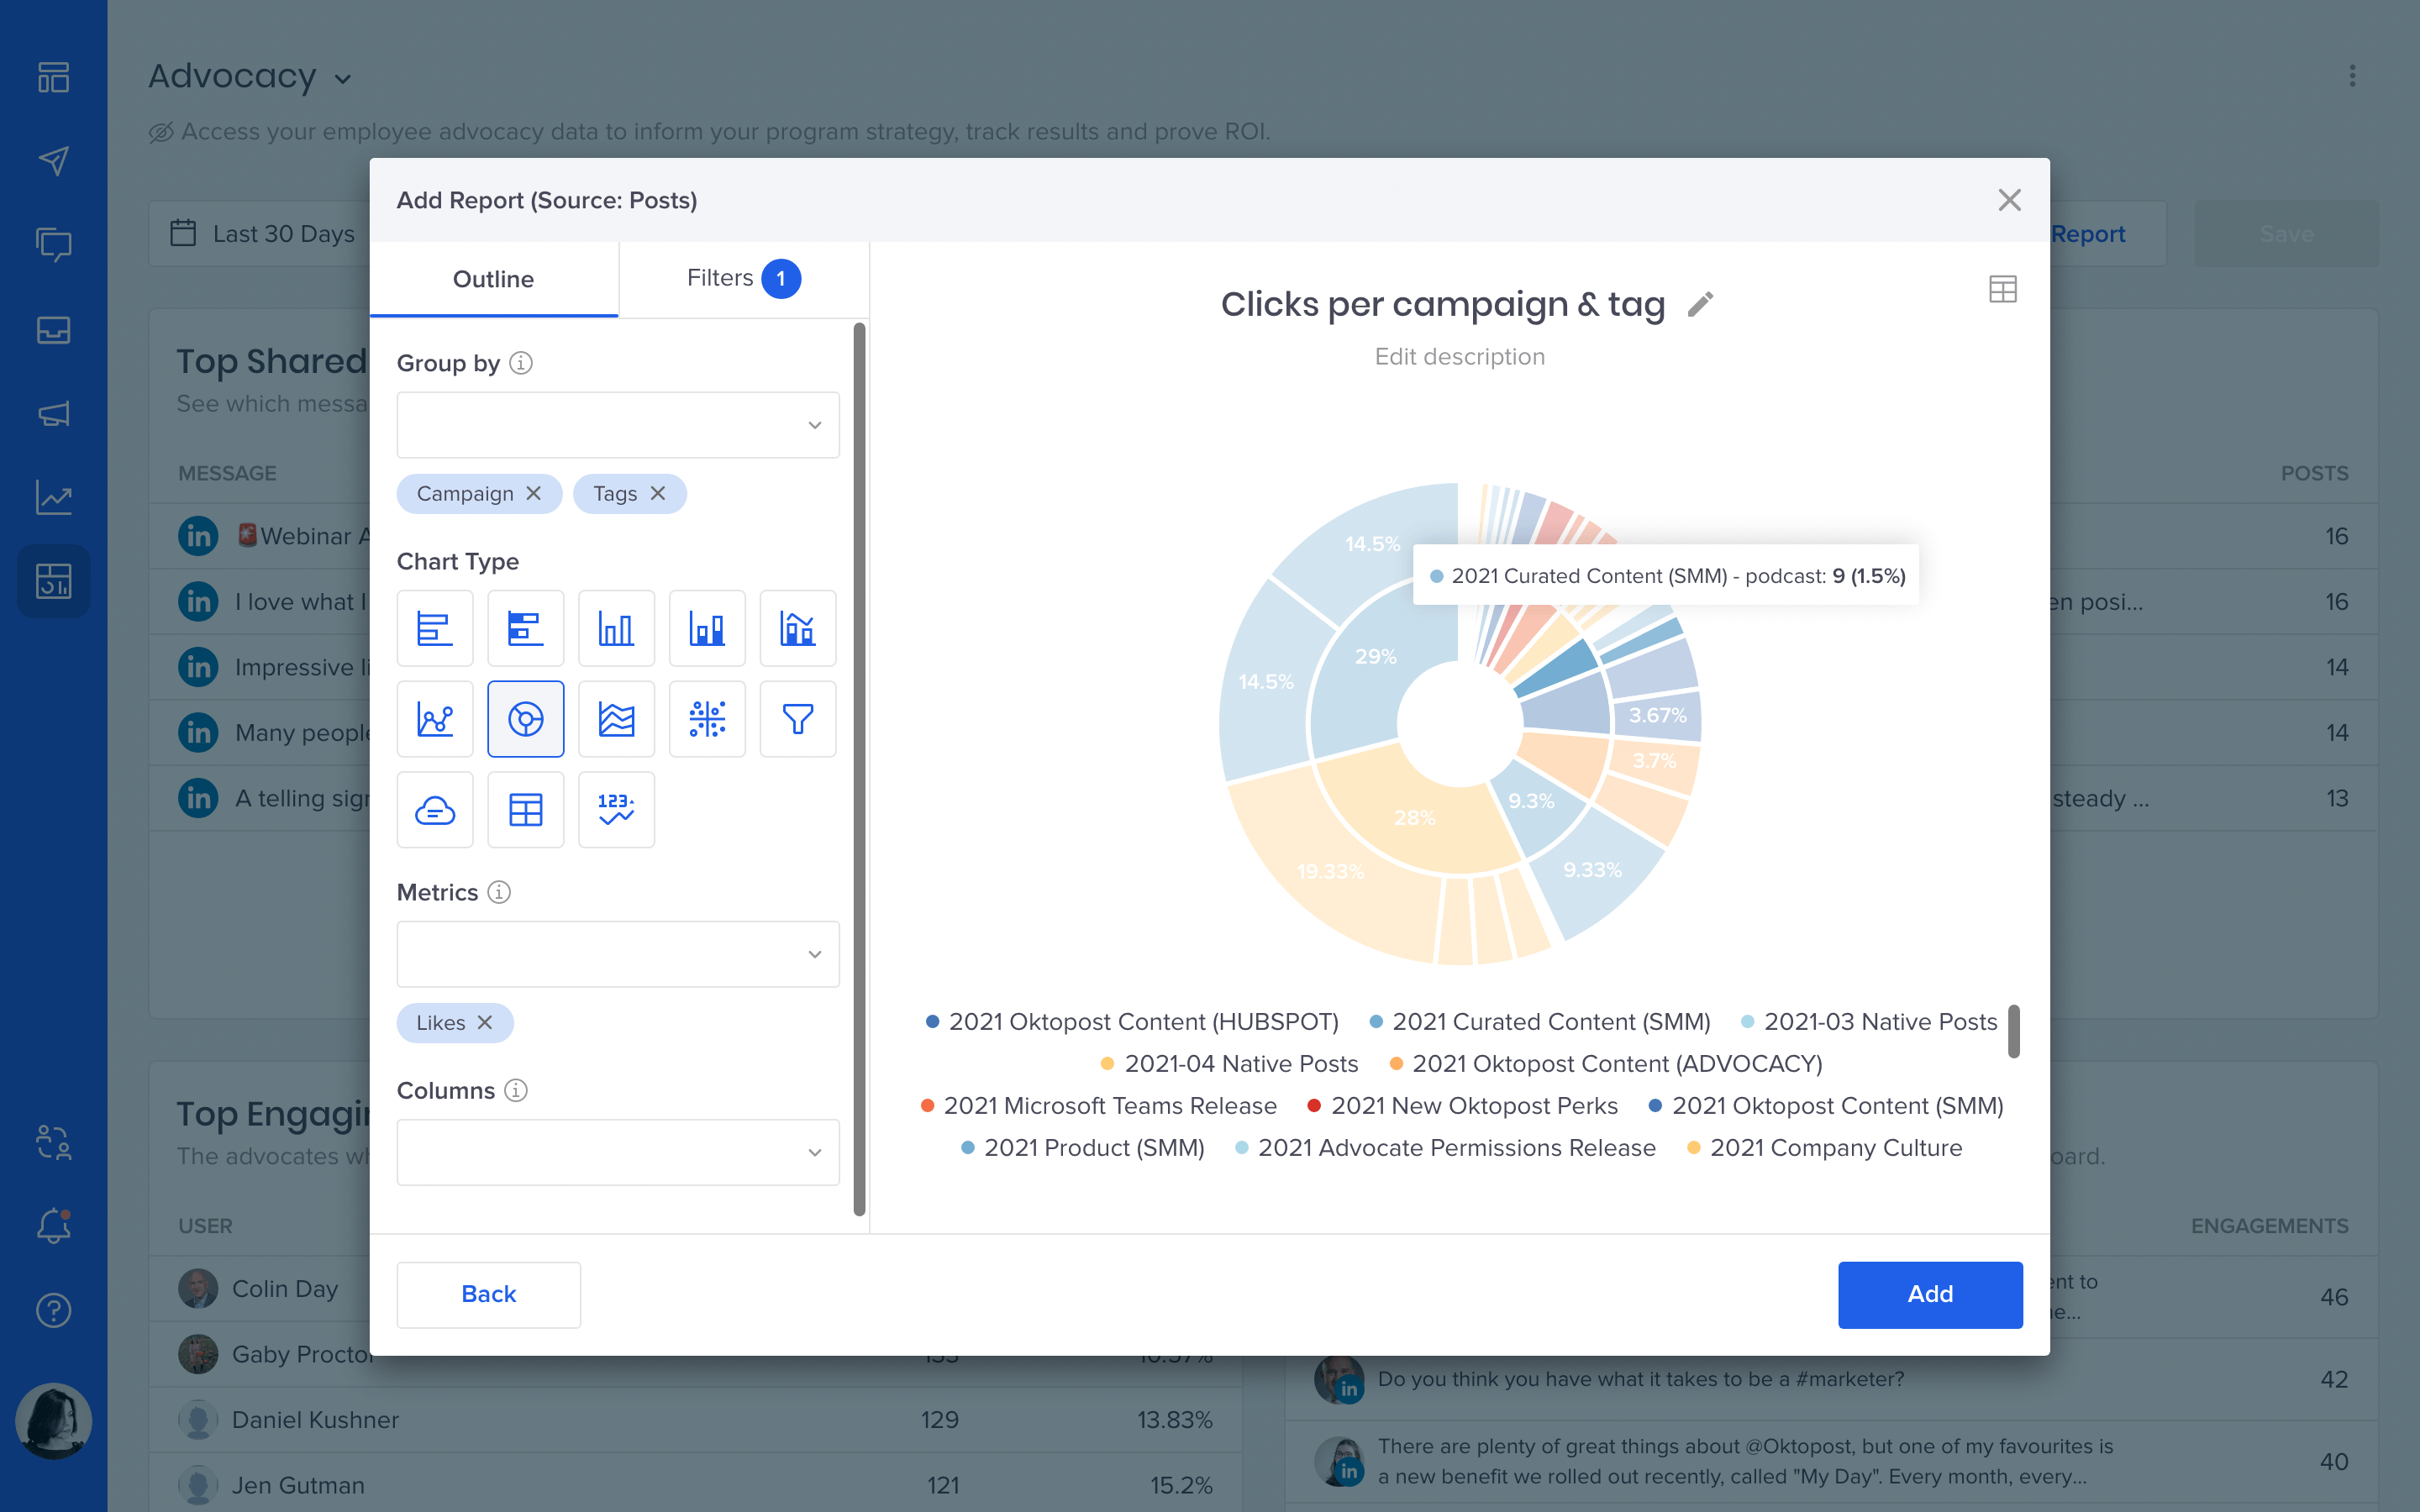
Multi-level pie chart
We hope you like pie charts as much as we do. The multi-level version is good for presenting a tree structure in a compact form. Use it for breaking down your data, for example: from a campaign down to tags, or from a network down to profiles.
Easier export
Finally, we updated how export works inside Social BI. Now your one-time exports can be auto-downloaded directly from the Export page instead of an email link. Yes, we’re not only saving trees by sending emails but also saving your inbox by not sending emails whenever we can.
As for recurring exports, now you will receive them as email attachments instead of links. That’s it for today, stay tuned.
We’d love to hear about your experience with Social BI, so please drop us a line if you have any feedback to share.