Engagement rates, impressions, and follower data across 9 sectors and 7 company sizes, from Oktopost's proprietary B2B dataset.
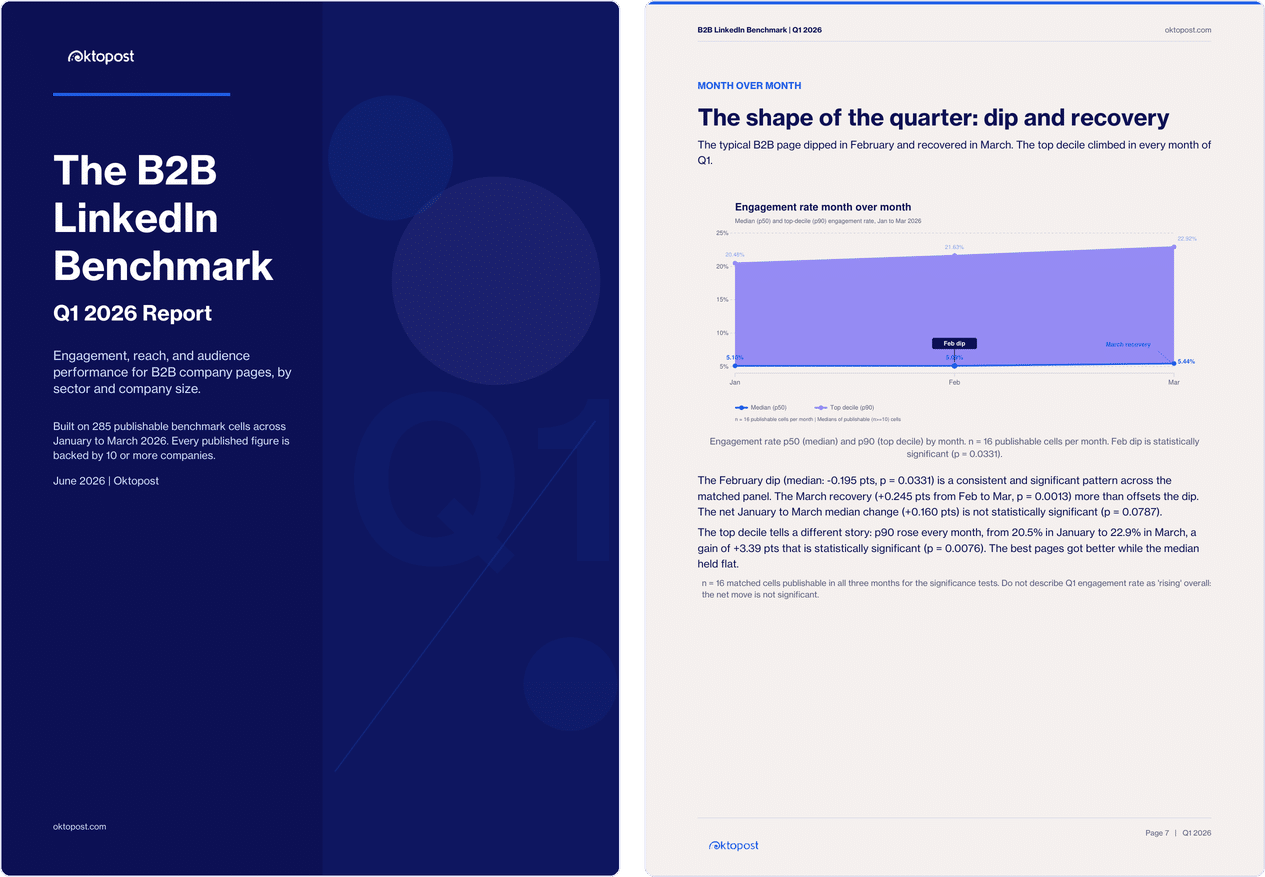
The headline Q1 story is a February dip followed by a March recovery, not a steady rise. The typical B2B page held close to a 5.1% engagement rate across the quarter, while the best-performing pages widened their lead. The net January to March change in the median was not statistically significant, so we report the dip-and-recovery pattern and the widening top decile, both of which are.
The dataset reports 7 metrics across 9 B2B sectors and 7 company size bands. Every cell carries three percentiles (p50, p75, p90) plus its sample size, so you can see both the benchmark and the strength of the data behind it.
Sectors covered:
Company size bands (by employee count):
One disclosure up front: the 5,001 to 10,000 employee band had zero publishable engagement-rate cells in Q1, so it does not appear in any published figure. We show this as an empty slot rather than fill the gap. That is a trust signal, not a gap to hide.
| Metric | p50 (median) | p75 | p90 |
|---|---|---|---|
| Engagement Rate | 5.30% | 9.49% | 26.24% |
| Follower Growth Rate | 1.16% | 1.92% | 3.22% |
| Engagement per Post | 51 | 148 | 481 |
| Impressions per Post | 927 | 1,734 | 3,635 |
| New Followers (per month) | 185 | 620 | 1,597 |
| Total Followers | 15,283 | 45,184 | 92,856 |
| Engagement per Profile Post | 7 | 29 | 74 |
Sample benchmark: Technology sector, companies with 201 to 500 employees, March 2026 snapshot (n = 26 to 67 companies per metric, every figure backed by 10 or more companies). The full Q1 2026 dataset across all sectors and company sizes is in the report PDF.
The data is drawn from B2B LinkedIn company pages tracked through Oktopost. For each metric, sector, and size cell we compute the p50, p75, and p90 percentiles across the companies in that cell for the month. A disclosure floor of n=10 applies: cells with 10 or more companies are published, cells with 5 to 9 are treated as directional, and cells with fewer than 5 are suppressed entirely.
Roll-up figures are the median of publishable cells, and the Q1 figure for a metric is the median of its monthly representatives. We use medians throughout, not means, to resist small-cell and outlier skew. Month-over-month significance is tested with a matched-panel paired Wilcoxon signed-rank test over the cells publishable in every compared month. The report covers monthly snapshots for January, February, and March 2026. The full methodology and suppression rules are documented in the accompanying PDF report.
Looking for the most recent monthly data? See the April 2026 LinkedIn benchmarks by industry.
Start by finding your sector and company size, then compare your own page against the percentiles. The p50 is the midpoint: half of comparable B2B pages land at or below it. If you are at p50 or above for your sector and size, you are keeping pace. Reaching p75 means your page sits in the top quarter of B2B pages like yours, and p90 puts you in the top decile.
The inverse size effect is the most practical takeaway. Smaller pages consistently posted higher engagement rates than large enterprise pages across all three months, so size is not an excuse for low engagement. A focused page with an active audience can and does outperform a much larger one. The widening top decile tells the same story from the other side: the gap between the median page and the best pages grew every month, so there is real room to climb.
Want to see exactly where your page sits? Use the free Oktopost LinkedIn benchmark tool to enter your own metrics and compare against this dataset.
PDF report. The designed Q1 2026 report covers findings across all 9 sectors and 7 size bands, with methodology, suppression disclosure, and statistical significance notes. File size: 252 KB. Download the PDF report.
Data produced by Oktopost. Free to reference with attribution. See our terms of use.
Oktopost has produced this benchmark monthly since December 2025. The Q1 2026 edition is the first publicly released quarterly report, covering the January, February, and March 2026 snapshots. It is updated quarterly. Publisher: Oktopost.
Data covers B2B LinkedIn company pages only. Personal profiles are excluded. Q1 2026 = January, February, and March 2026 snapshots. Figures across the quarter sum to 9,077 metric-cell samples across the three monthly snapshots, not 9,077 unique pages.
See what the median, top quartile, and top decile B2B pages achieved on LinkedIn in Q1 2026, segmented by your sector and company size.